Issue 5 | AOFM Investor Insights | September 2020 | PDF
This edition of Investor Insights is on the liquidity of the Treasury Bond market and its importance to the AOFM and investors.
Investors rely on the deep and liquid secondary market for Treasury Bonds (TBs) to buy and sell in good volume with minimal price impact. For the AOFM, this means lower borrowing costs over time as well as reduced funding risk in the primary market, since demand is more consistent and ongoing investor support for the AGS market can be reliably factored into AOFM issuance expectations.
The bulk of AOFM's funding task is carried out through regular issuance (‘bond line tapping’) into a relatively small number of TB lines, so the liquidity of that market is of high importance to the AOFM. Even when new maturities are established, the AOFM has a focus on being able to issue sufficient volumes within a reasonable period to achieve good market liquidity in a new line without undue delay.
Features of the Treasury Bond market that enhance liquidity
- A medium-sized bond market of about A$673 billion in face value.
- Large, liquid bond lines with maturities across a 30-year yield curve.
- Regular and consistent primary market issuance (that takes account of prevailing market conditions).
- Strong underlying investor demand due to the strength and resilience of the Australian economy and a positive yield differential compared with many of the major sovereign markets.
- A diverse investor base by geography and type.
- A highly competitive primary and secondary market with a large number of intermediaries bidding at tenders and making tight two-way prices in secondary.
- The relative ease and low cost of hedging interest rates with a highly liquid bond futures market.
- Good access for many investors to Australian dollar funding, including repo, interest rate swaps and FX forwards.
- AOFM's security lending facility, which provides a 'last resort' for market makers if they are unable to source a bond line in the market.
Indicators of strong liquidity in the Treasury Bond market
- Consistent secondary market turnover, which is increasing over time.
- Strong primary tender results in terms of coverage and spreads to secondary market rates.
- Competitive secondary pricing with generally tight bid/ask spreads.
- A wide and diverse range of investors participating in AOFM syndications.
- Regular positive feedback around liquidity from investors and intermediaries.
The size of the Treasury Bond Market
The Treasury Bond market is sufficiently large, diverse and liquid enough to support both substantial and small investors. Table 1 shows the respective size of the largest nominal sovereign bond markets as measured by the Bloomberg Barclays Global Aggregate Treasuries Index. This index includes bond lines greater than one-year in maturity, issued in local currency. The Australian TB market is the 11th largest in the world (as measured by the index).
Table 1: Size of respective sovereign nominal bond markets
| Country | Market value (US$b) | Average line size (US$b) | Number of lines | Average tenor (years) |
|---|---|---|---|---|
| United States | 9,008 | 35 | 261 | 8.6 |
| Japan | 8,578 | 31 | 274 | 10.8 |
| Britain | 2,247 | 48 | 47 | 17.3 |
| France | 2,153 | 46 | 47 | 10.9 |
| Italy | 1,953 | 25 | 78 | 9.1 |
| China | 1,620 | 11 | 145 | 10.5 |
| Germany | 1,577 | 30 | 53 | 9.5 |
| Spain | 1,241 | 29 | 43 | 10.3 |
| South Korea | 593 | 12 | 50 | 12.3 |
| Belgium | 532 | 18 | 30 | 12.1 |
| Australia | 517 | 19 | 27 | 8.6 |
| Canada | 485 | 14 | 35 | 8.8 |
Total TBs outstanding as at 11 September 2020 was A$673 billion, comprising 29 lines with maturities out to 2051. The average line size is around A$23 billion (US$19 billion). This puts Australia in a ‘medium category’ for outright size. Although smaller than the very largest sovereign markets, consistent feedback from investors and intermediaries is that the liquidity of the Australian TB market compares favourably with similar-sized markets and even much larger ones.
Australia has fewer but larger average bond lines with a shorter average tenor (compared to similar-sized markets). The AOFM considers that building up bond lines quickly to a size of at least A$20 billion adds noticeably to the liquidity of them. The average line size of TBs less than 13 years tenor is even larger at A$27 billion.
Growth of the funding task
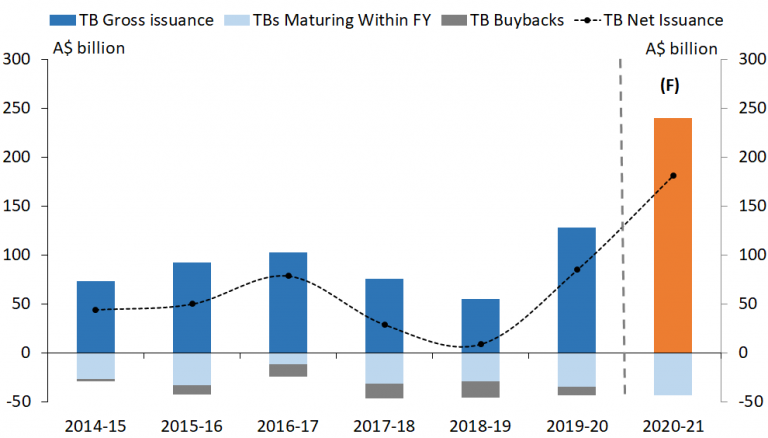
Chart 1: Annual Treasury Bond issuance program
Fiscal responses to the COVID-19 pandemic have resulted in significantly higher bond issuance globally and in Australia, which means much higher rates of issuance need to be absorbed by end investors. This can present a challenge for issuers operating in a ‘crowded market’ competing for investors. On the other hand, greater issuance will lead to a bigger TB market, which may increase its attractiveness for investors since it implies a greater capacity to facilitate large volume trades.
How does the AOFM support liquidity of Treasury Bonds?
Many factors that impact the demand for and liquidity of TBs are outside the control of the AOFM. These include global and domestic economic and financial conditions, the regulatory environment, and the size of the funding task.
However, some ways the AOFM does have a positive impact on liquidity are through the choice of funding program mix (through the AOFM’s debt issuance strategy). This includes:
- issuing into demand;
- building up a small number of bonds lines quickly to a liquid size;
- supporting the futures contracts;
- maintaining some flexibility in the rate of issuance;
- the method of issuance (tender or syndication); and
- being regular and consistent in our market operations which is backed by transparent communication of the funding program and issuance strategy.
Debt issuance strategy
Liquidity is a key consideration in the AOFM’s debt issuance strategy. A key point of difference between the TB market and other markets is that the TB market does not have ‘on the run’ and ‘off the run’ bonds. Instead, the most liquid bonds are those around the futures baskets. Chart 2 shows TBs on issue at 30 June 2020 and new issuance since then.
Chart 2. Treasury Bonds on issue
The bulk of TB issuance is primarily into the parts of the curve associated with the 3 and 10-year futures baskets; these offer the deepest liquidity. Most new bond lines are established to support the TB futures contracts. The introduction of an additional 5-year futures contract by the ASX expected in late 2020 will provide extra points of deep liquidity on the curve for the AOFM to issue into.
Supporting liquidity is a key factor in determining the number and size of bond lines – in general, larger bond lines are more liquid. However, the AOFM recognises that there is a balance between managing the benefits of added liquidity in individual large bond lines and ensuring there is sufficient liquidity in other parts of the curve; declining issuance programs over the last few years, in particular, have highlighted this trade-off. AOFM’s assessment, based on market feedback, is that a liquid ‘benchmark’ TB line is at least A$20 billion for TBs supporting the 3 and 10-year futures contracts.
From Chart 2 it can be seen that all TB lines out to Nov 2031 (except for two very short bonds) are greater than A$20 billion in size. Seven of these lines are more than A$30 billion. Bond lines longer than Nov 2031 are generally lower in volume size because the dynamics of that part of the market are different and tend to reflect fewer and less active investors. However, these lines can and will be built up more slowly over a longer period. The AOFM regularly monitors trading and demand in this part of the curve to calibrate the issuance required to support functional liquidity.
Larger bond lines help to facilitate trading since it is less likely the bond would be tightly held by a few investors. It also allows traders to more comfortably ‘short’ a large bond line knowing it can more easily be sourced in the secondary market or borrowed from the lending facility. The AOFM also regularly issues ‘in‑demand’ bond lines as part of its tenders which gives traders confidence that stock will be available. Relatively consistent large, bond line sizes across the curve allow investors to more easily ‘switch’ out of one bond line into another. The new 5-year futures contract should also help to manage the transition of large lines as they move from the 10-year to 3-year futures basket.
Indicators of liquidity
Secondary market turnover
The AOFM collects secondary market turnover activity by a survey from market makers every month. The survey includes 18 market makers and comprises the majority of trading activity. The data consists of purchases and sales to investors and other market makers and is reported according to specific regions and tenor ranges.
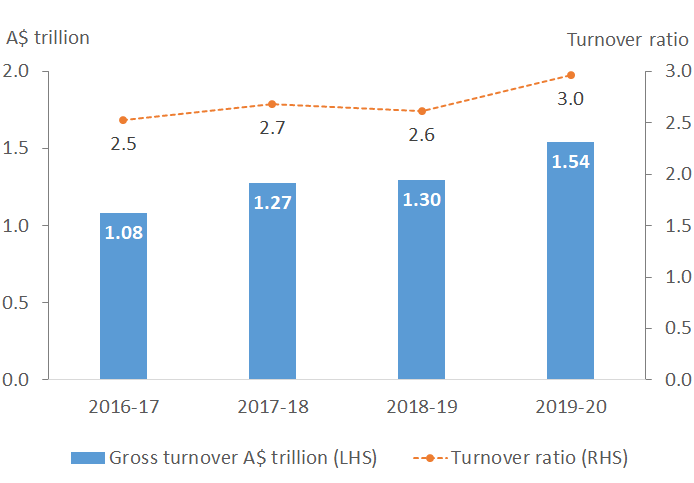
Chart 3. Treasury Bond turnover
Chart 3 shows annual TB turnover has been increasing year on year with the turnover ratio (the measure of bond market turnover compared to outstanding of TBs) being at a recent high in 2019-20. This is despite the issuance also being at an all-time high. Annual turnover in 2019-20 was A$1.54 trillion or around three times the average volume on issue.
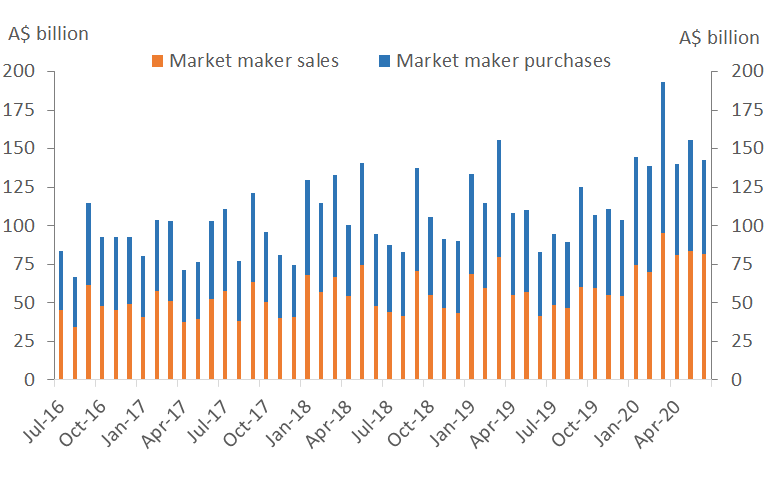
Chart 4 shows monthly turnover for purchases and sales by market makers to investors (excluding amounts between the AOFM).
Chart 4. Monthly Treasury Bond turnover
Some trends of note in the monthly data are that monthly turnover is higher in futures expiry months; months with high issuance (especially syndications); months in which bond maturities are reinvested; and months with large bond market index extensions. Notably, the highest turnover month in March 2020 coincided with unprecedented volatility in global financial markets. This period saw significant investor selling in which AGS was one of the few liquid assets that could be sold to raise cash. The important role of the RBA in stabilising financial markets and the subsequent strong recovery in the AGS market was discussed in Investor Insights Issue 4 as well as the AOFM CEO market update provided at the Australian Business Economists webinar in July 2020. Turnover data from intermediaries shows that for the period from when the RBA commenced buying TBs in the secondary market to the end of June 2020, trades with the RBA comprised around 7 per cent of total turnover. This demonstrates that even in a period of high volatility, the amount of secondary market trading with investors and other banks continued to increase and, on a monthly basis, overall turnover was relatively balanced between purchases and sales.
Secondary market trading
A feature of the TB secondary market is the large volume of trades by market makers and the relatively large number active in the market. There are currently 18 market makers in the AOFM turnover survey, most of which make tight two-way prices for investors. Healthy competition is a feature of the secondary market with no single bank dominating turnover – in 2019-20 the top six market makers comprised around 69 per cent of total turnover.
Table 2: Secondary market transactions
| Total number of trades* | Average trade size (A$m) | The proportion of TB turnover transacted by the top six market makers (%) | |
|---|---|---|---|
| 2016-17 | 85,600 | 12.6 | 66 |
| 2017-18 | 85,900 | 14.8 | 59 |
| 2018-19 | 89,500 | 14.5 | 65 |
| 2019-20 | 103,800 | 14.9 | 69 |
Feedback from intermediaries suggests, in typical markets conditions, that trade sizes of up to A$500 million are possible within a short time frame in the most liquid 3 and 10-year TB lines without significantly moving market prices. Even higher amounts of A$1-2 billion can be transacted over one or two days with minimal market impact. In the most liquid bond lines, two-way prices for investors can be as tight as 0.1 basis points for amounts of around A$100 million, especially when transacted by EFP rather than outright. In the less liquid 20 to 30 year part of the curve, lower but still significant volumes can be executed with wider, but still competitive bid/ask spreads.
Tender performance in the primary market
Strong primary tender results are complementary to a deep and liquid secondary market and reflect underlying investor demand. In the short to medium-term intermediaries have some capacity to 'warehouse' bonds they take down in tenders. However, intermediaries would be unable to bid consistently over a long period if they did not have confidence in end investor demand. In 2019-20 the average coverage ratio in tenders was around 3.7 times, and the average spread to secondary market yields was -0.3 basis points. In the June 2020 quarter, the sharply higher issuance rate was met with an even higher volume of bids. There was around 4.6 times the volume of bids than the amount issued, the average spread to mid-market yields was -0.6 basis points, and nearly 70 per cent of bids were at lower yields than the secondary mid-market yield.
Chart 5: Treasury Bond tender performance
There is strong competition in primary tenders. In 2019-20 17 banks were awarded bonds in tenders with the top six counterparties comprising around 83 per cent of total take-down, which is a little more concentrated than secondary turnover. The AOFM does not use a 'primary dealer' system in which banks are obligated to buy a certain amount of bonds or to make two-way prices in secondary. Instead, their participation is based solely on market incentives and competition. Notably, no bank has 'left' the AGS market in over six years.
Conclusion
The liquidity of the Treasury Bond market is of high importance for the AOFM and investors. Regular feedback from investors attests to the strong secondary market liquidity for Treasury Bonds. Important ways the AOFM supports liquidity includes regular issuance that takes account of investor demand and market conditions as well as clear communication and transparency regarding the AOFM’s operations and issuance strategy.
A clear indicator of liquidity is the high levels of secondary market turnover demonstrated by the AOFM’s secondary market turnover survey. The data provides both the AOFM and the market with granular detail on not only the levels of turnover but also turnover by investor region and types (for domestic investors) as well as by tenor ranges. This helps the AOFM better understand broader demand and liquidity for particular segments of the market. It is planned to explore the liquidity of AGS in future editions of Investor Insights.


