Australian Business Economists luncheon
Delivered by Ian Clunies-Ross, Head of Investor Relations, on behalf of Rob Nicholl, CEO.
Thank you to the ABE for again providing an opportunity for an AOFM update. As the title suggests, we are back in circumstances of conflicting signals.
Despite differing views on what lies ahead globally, a common theme is that circumstances remain a hostage to low inflation; low labour productivity and wage increases; below-trend GDP growth; and the prospect of further reduced international trade opportunities – or at the very least an extended period of global trade disruption. This is at a time when the likelihood for another appreciable slowdown sits below certainty – but uncomfortably above zero.
How the AOFM views the outlook in most part relates to financial market dynamics, but obviously we keep an eye to any build-up of threats to the Government’s fiscal outlook.
Today I will relate back to comments from last year on issuance patterns for market maintenance programs. I also foreshadowed a review of our approach to cash portfolio management and an outline of how this will change our reliance on Treasury Notes will, I hope be useful.
I will also outline an internal project that is helping us better understand structural changes to the AGS market, and in turn the potential for changes to the investor base.
A brief update on the steps we are taking to implement the new Australian Business Securitisation Fund will wrap-up the presentation.
But first some comments on issuance.
For the coming year we have announced a program of $58 billion in nominal bonds and $2.5 billion in linkers. The nominal bond buyback program will be increased from the $15 billion mark we have been using, to a range of $15‑20 billion. The increase simply reflects larger maturities that will roll-down from the 3‑year futures contract in the years ahead. Continuing to appreciably reduce the size of bond lines ahead of maturity will require more frequent and/or larger buyback tenders.
Two years ago average term to maturity of Treasury Bond issuance was 10½ years; last year it was 11 years; and this year it will be just over 11 years. Next year we are anticipating a continued focus on 10-year basket bonds, including the need to fill a maturity gap for the futures contract, and an aim to further enhance liquidity in ultra-long bond lines. This suggests that the overall issuance pattern will again be similar in average tenor to this year.
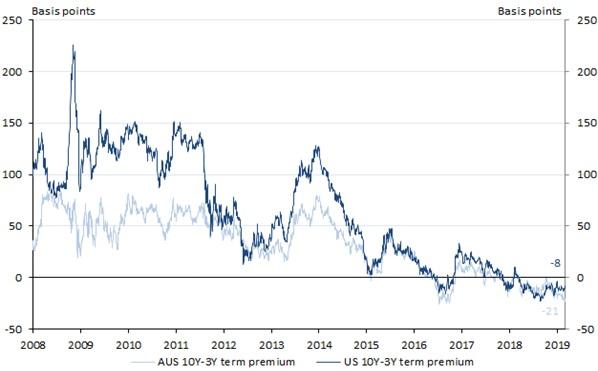
The following chart shows a comparison of 10-year/3-year term premium estimates for AGS and USTs. Low or negative term premiums, while enduring, are not the only motivator for continuing with a long issuance bias, but they do indicate that it will most likely be cost-effective. For us, reducing future funding risk still ranks highly in setting the annual issuance strategy.
Chart 1: AOFM and US Fed Term Premium Estimates
Turning to liquidity support in general, a declining financing task requires some issuance changes, mostly in so far as the number of new maturities to be established.
In terms of linkers, high gross issuance this year was underpinned by the launch of the 2050. As I said after that transaction, we were surprised by the level of demand it attracted. By most accounts the print volume was seen as large but it seemed to facilitate good liquidity generally for a while thereafter; and overall the market looks to have absorbed this transaction smoothly.
The next new TIB will be a 2032 or 2033 maturity launched as a 10-year benchmark line. And consistent with past practice we will monitor domestic investor demand to judge whether adjustments are warranted to the planned issuance total.
In terms of our ability to read the linker market - the past six months in particular has been difficult. On a number of occasions we have expected weak tenders only to watch them finish with high coverage ratios and aggressive issuance yields. It wasn’t that long ago we thought we had a close understanding of this market given our regular liaison with banks and domestic investors, but these recent instances have tested our confidence in that regard.
As to the nominal market, we see reduced financing tasks as a good thing but this means issuance over the coming years will be more concentrated into certain parts of the yield curve.
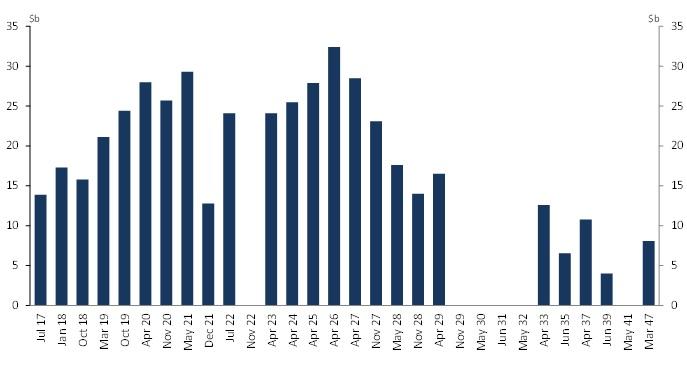
The following chart shows nominal bond lines outstanding at the end of June 2017.
Chart 2: Treasury Bonds on issue June 2017
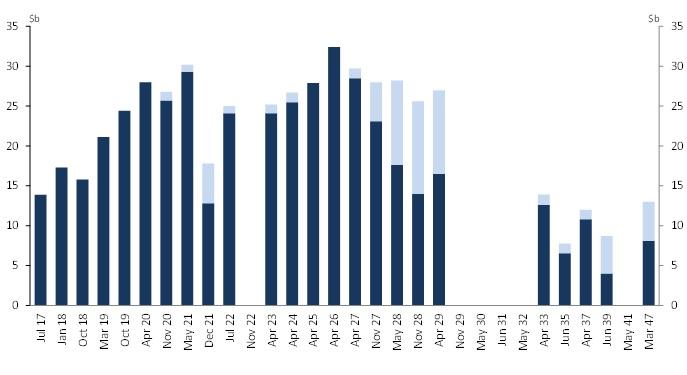
Now add issuance since then through tapping existing bond lines – represented by the light blue portions in the following chart. It is clear the extent to which this pattern of issuance has focused on bond lines underlying the futures contracts, especially the 10‑year contract.
Chart 3: Issuance into existing lines since June 2017
Source: AOFM
With issuance forecast to remain at lower levels, this pattern is unlikely to change. There are three reasons for this. First, in pure market maintenance mode a long-standing Government policy of supporting the futures contracts will continue. Second, over the last two years there has been a concentration of demand in and adjacent to the futures contracts. While we are not averse to issuing other parts of the curve, we don’t see consistent demand sufficient to require us doing that on a regular basis.
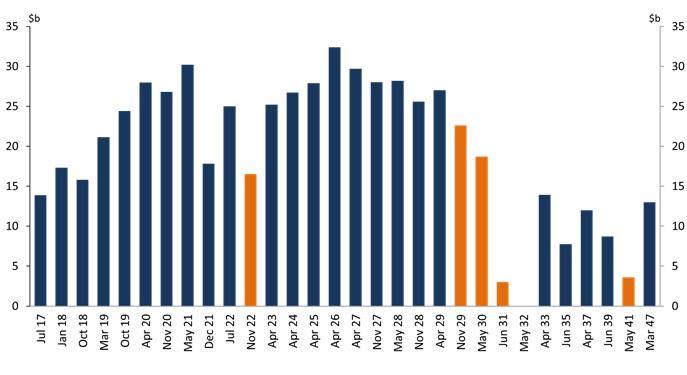
The third issue relates to new maturities. There are five new maturities as you can see since June 2017 with each established specifically to enter a futures contract.
Chart 4: New lines established since June 2017
Source: AOFM
Once launching a new maturity we feel committed to bringing it up to, or at least approaching, a benchmark trading level before it enters a contract. That won’t change, but obviously maintaining the number of new maturities will compete with lower issuance programs. Last year we abandoned the practice of establishing new maturities at the five-year point on the curve. However, filling maturity gaps ahead of the 10‑year futures contract will continue, but only at the rate of one maturity per year – rather than the two we have established in recent years.
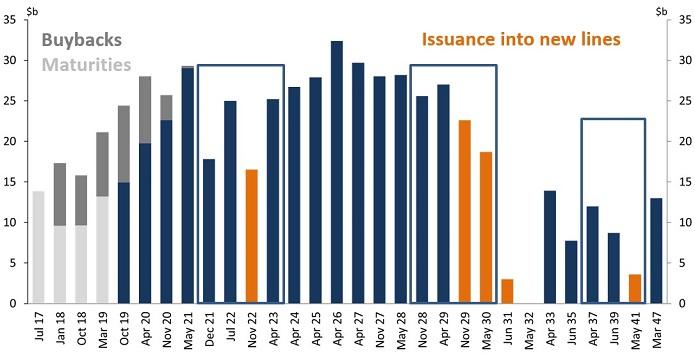
Lastly on Treasury Bonds – the following chart shows maturities in the past two years (in light grey) against buybacks (the darker grey portions).
Chart 5: Treasury Bonds on issue at May 2019
Source: AOFM
As I noted earlier we will continue the regular buyback program, and as you can see from this chart we reduced the two 2018 lines and the March 2019 line by between a quarter and a third ahead of maturity. The chart also shows that we have just commenced buybacks for the November 2020 and May 2021 lines. But for a few investor comments questioning the justification for buybacks, we are pleased with how the program has proceeded and are now viewing it as a normal part of our market operations.
Turning to the Treasury Note program - this is not something that usually gets a specific mention but with some changes planned I thought it appropriate to give an update.
Back in 2013 as the outlook for issuance was progressively building we took the decision to run higher cash portfolio balances to bolster liquidity reserves. These reserves provide prudent operational flexibility and would also cover the possibility, however remote, of a sudden loss or severely reduced access to the market. While our assessments for this usually focus on times during the cash cycle when outlays and financing needs are forecast to be the highest, the required liquidity buffer to cover for a high issuance rate is markedly greater than for smaller issuance programs. We also thought back then that reducing our exposure to refinancing risk by reducing the reliance on Treasury Notes went hand-in-hand with other decisions at the time. Therefore, increased bond issuance was used to fund liquidity reserves. However, we are now about to unwind some of that strategy.
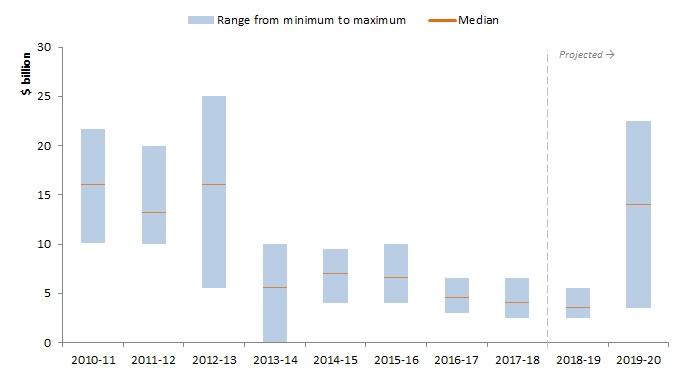
The following chart shows how Treasury Notes have been used to manage peaks and troughs in the cash cycle in the past.
Chart 6: AOFM reliance on Treasury Notes
Source: AOFM
Up to and including 2012-13, the median Treasury Notes market size was around $15 billion (or about 9% of outstanding AGS), with a range of around $10‑25 billion.
The early 2014 pullback in using Treasury Notes is clear from the chart and the median market size since then has been around $5 billion (or about 0.7% of outstanding AGS), and more recently accompanied by a within-year range of $3‑6 billion. The tighter range indicates that we have been relying far more consistently on running down asset balances to manage the cash portfolio over using Treasury Notes.
Commencing over the next few months a revised strategy will mark a return to the more active use of Treasury Notes, with a projected median market size of around $14 billion and a peak to trough range of up to $20 billion over the cash cycle. This level of issuance should remain steady over the next few years.
While we don’t see this as a dramatic change in approach, the result will be to lower the gross amount of AGS outstanding on average compared with the former strategy. This is because we can reduce the outstanding stock of Treasury Notes at times in the cash cycle when our cash balances are high. It should also help to reduce the costs of managing the cash portfolio over time. Furthermore, having reviewed the investment requirements of our cash portfolio operations we don’t see any need to move away from a reliance solely on term deposits with the RBA.
But enough on issuance; let me turn to the topic of tracking and analysing global capital flows to better understand shifting investor behaviour.
Understanding the motives for investor participation in AGS has occupied a large part of the AOFM’s market engagement efforts over the last 6 or 7 years. But even in the face of declining issuance programs the task of understanding changes to investor preferences will remain important. This is likely to be more challenging in the face of increased market volatility and the ongoing influence from monetary policy settings of major central banks.
In this context, financial market outlooks continue to oscillate between growth and financial stability scenarios and given that AGS is but a small part of the global sovereign bond market, it is clear that issuance conditions for us will be determined in most part by factors beyond our shores.
Exchange rates, changes in yields within and between markets, and continuing re-evaluations of investor risk appetite together highlight the potential for shifts in AGS investor behaviour patterns. This will remain something to monitor and we are aiming to improve our understanding of these changes.
To refine our approach to this we have developed a wide and more in-depth understanding of global capital flows. And what it is showing is that being able to systematically ‘follow the money’ provides timely knowledge as to factors influencing investor demand drivers.
Our project goal was to create a framework that covers global capital flows from important economic regions, as well as building the capability to systematically dissect these flows so as to understand changes from various perspectives. An important part of this is linking the elements into a broad but cohesive narrative about investor behaviour, which is focused on but not restricted to the AGS market. Ultimately, this provides a stronger basis for developing expectations for our portfolio strategies, while at the same time guiding us in how we should question investors and intermediaries.
While these tools have broad applicability I am going to draw on observations of Japanese investor activity from earlier this year as an example. One of the reasons the Japanese investor community offers a good example is because the reaction of these investors to changes in market conditions and dynamics tends to be homogenous. This is not to say investors from other regions wouldn’t react similarly under certain circumstances, but diversity elsewhere tends to be richer and therefore less easy to summarise. Another reason to pick Japan is because the available data are very comprehensive and help to facilitate detailed analyses.
Japanese investors were strong buyers of global fixed income coming into 2019 with associated flows being large compared to most of last calendar year. Overall, global credit demand also increased but from an annual low in the tail end of 2018. During the first quarter of 2019, overall global credit demand showed steady growth but net flow size remains at levels below what would typically be considered as average.
Global equity market volatility in the last quarter of 2018 triggered a large net sell-off followed by a repatriation of capital to Japan. However, a breakdown of this reveals a continued Japanese preference for USD equities over almost all other markets; although Japanese investors made appreciable allocations into Chinese equities following on from the initial repatriation. Indeed, at the start of 2019, based on 12-month cumulative volume, China was one of the larger allocations over the past year and it appears as though Japanese investors have been building structural positions. This strategy looks to have been ahead of the curve given the recently announced index weight changes by MSCI where China ‘A’ shares, currently representing 0.8% of the MSCI Emerging Market Index, will now be assigned a weight of 3.3%. Some reports have this triggering up to US$80 billion of net capital inflow into China ‘A’ shares as a result of portfolio restructuring.
In the meantime, net new demand for USTs generally continued building. Combining this with observations on US capital flows has now confirmed what we are interpreting as a structural shift into USD fixed income by Japanese investors that started during the third quarter of 2018. This was after a prolonged period of USTs selling by the Japanese, driven by a range of factors including: both hedged and unhedged returns; FX levels; and expectations of future yield movements. As long as this structural demand for USD remains, demand for other smaller markets (including Australia) will be constrained.
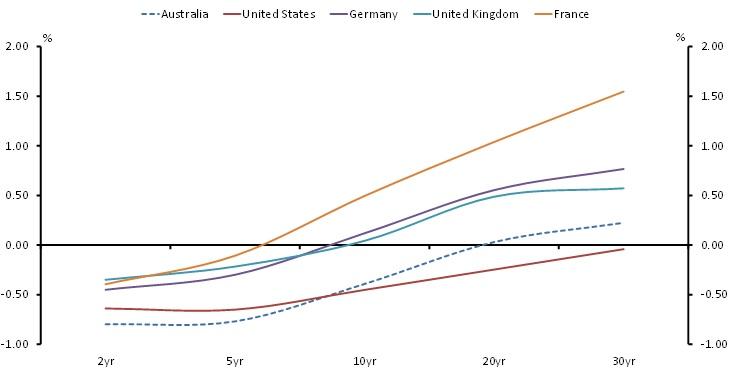
In terms of demonstrating the impact of hedged returns on capital flows, Japan again provides an excellent example. Besides the flow into USDs, the big standout this year has been the significant flow into French OATs. From an unhedged perspective, French OATs provide one of the lower yields of any advanced economy sovereign bond market. And while they tend to trade at a positive spread to German Bunds the outright yield levels are rather low. In comparison, markets such as UK Gilts, USTs or AGBs offer substantially higher outright yields.
However, should Japanese investors hedge the various curves back into JPY the picture changes. France’s OATs now become one of the highest yielding sovereigns from this group; and even better, they yield more than unhedged bonds.
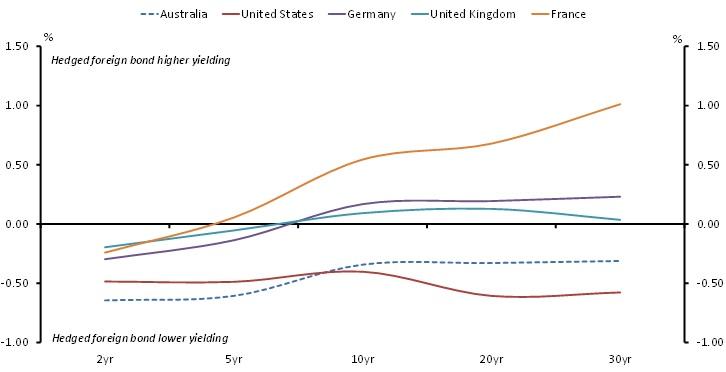
The following chart shows how yields for AGS, USTs, Bunds, Gilts and OATs recently appeared to Japanese investors looking to invest on a hedged basis using 3‑month FX Forwards. Bunds look to have been a second preference with AGS not offering a positive return unless investors were prepared to take duration risk by going quite far out along the curve. Interestingly, AGS longer than 10‑years did look relatively more attractive to USTs in this scenario. The reasons for these outcomes, however, are largely because of the shape of the FX-Forwards curve.
Chart 7: Hedged sovereign yield curves for Japanese investors
Source: Bloomberg
We have observed that the attraction of higher hedged yields in French OATs relative to other sovereigns for Japanese investors caused a substantial capital inflow to that market, especially from Japanese banks. This feature was also a motivator to buy French credit, with even higher yields on offer. Feedback from several investors over the last six months confirms these observations.
The following chart shows for various sovereign markets the post-hedged return spread to JGBs. Once again, you can see that AGS was a challenging decision for them with our whole curve presenting a negative post-hedge return spread to their home sovereign market. Therefore, investing in our market is more likely to occur via a non-hedged position, which inherently requires taking a view on the relative strength of the AUD, as well as an assessment of value from the current exchange rate.
Chart 8: Hedged sovereign yield curve spreads to JGBs
In terms of currency demand, the USD and EUR have dominated in fixed income markets over the last 12 months, with the Japanese investor community, led by pension funds and banks, having been the main buyer of global fixed income; although we haven’t seen a lot of these flows into AGS.
The USD/JPY exchange rate influences the extent to which Japanese Life Insurance companies have demand for global fixed income, and its current level would not look attractive to them. Indeed, in their recent reports Japanese Life Insurance companies noted that they will be looking outside of traditional fixed income markets in their search for yield. Taken together, this does not suggest strong demand for AGS from this sector anytime soon.
Overall, our observations suggest the following Japanese investor reactions:
- when purchasing USTs, they currently do so on an unhedged basis;
- when purchasing European government bonds, they currently do so on a hedged basis; and
- when purchasing AGS, Japanese investors will need to increase their exposure to both currency and duration risk in order to maintain returns in current market conditions.
I have highlighted a few examples impacting Japanese investors but our ability to apply this type of analysis to a range of regions, investor bases and types, and asset markets is extensive. And as part of the project we are also exploring ways to better understand what is driving the decisions behind shifts in capital flows. For instance, sticking with the Japanese example, this will involve being able to better anticipate how demand may evolve through time. While we are not expecting to land ourselves in the realm of supernatural predictive power, every step forward in recognising how the AGS market is positioned as an investment alternative in a global context should make AOFM a better debt portfolio manager, a better judge of how the AGS market can be best supported through issuance choice, and a better adviser to government should a future need arise to appreciably increase issuance.
You may recall that last year I alluded to our wariness about thinking of AGS issuance as unlimited in all circumstances. Well I might not have been that direct but you get the picture. But while the overall level of demand has remained supportive of our programs, what I have just summarised highlights one dimension of the potential for difficult issuance conditions to emerge. And there have been times over the past few years in which we were reminded that challenges can emerge without much warning.
I can’t reasonably foresee circumstances in which the AOFM would lose access to the market for a prolonged period, and even in the event such a situation was to unfold, it would likely be in the context of a significant global market dislocation. But at times we have observed tightness that reinforces our base case thinking, which is to exercise humility as the rule rather than as an exception. Whether it be high repo rates impacting certain parts of our investor base, an appreciable build-up of stock in the hands of our market makers, limits on our ability to issue large volume into ultra-long maturities, or sharp changes in exchange rates and yields in markets seen as an alternative to AGS, these are all things that shape our expectations on the costs of and risks to our portfolio aims and issuance intentions.
Yes Australia enjoys a triple-A rating. Yes the AGS market is viewed as offering a broad range of choice to domestic and offshore investors – from a focus on tactical trades in the short-end, to those looking to hold strategic positions in ultra-long maturities. Yes, the size of the AGS market is now more globally relevant and as a consequence enjoys a diverse investor base. And yes the AOFM understands the importance of being transparent and relatively predictable.
But in order to maintain an awareness of how best to achieve our roles of financier for government and custodian of the domestic sovereign bond market, we need to assume that active, informed decision making trumps complacency any time.
I am going to finish with a few comments on the Australian Business Securitisation Fund. I won’t go into detail - firstly because we are still working some of that out, and secondly because I recognise that the audience looking for detail will not necessarily overlap much with this audience. That said, we will be holding targeted industry briefings in Sydney and Melbourne next month to provide yet more detail to the SME lending sector.
One thing that became apparent during development of the legislation was that implementation of this program was going to be complex. This means it could take some time yet to land on appropriate arrangements to support our role. The important thing to note is that the policy objective is to facilitate development of the SME lending sector.
One thing we are not interpreting from this is that the Fund should be rolled out at maximum speed by simply injecting subsidised government sourced financing quickly into the market. While I can understand how potential borrowers may see the program as providing an opportunity for immediate relief to some unmet demand for small business financing, the overarching objective and purpose is far more subtle than that. In fact I see an approach in which measured judgement is subordinate to haste will lead us into an inferior outcome. Of course that is not to say establishing the program isn’t a priority.
However, to run this program well the task requires us to have: a thorough understanding of the sector; a practical working grasp on how we can use the Fund to foster transparency - so as to make the sector more attractive to investors over time; and a clear plan as to how we can incrementally consolidate the benefits of our investment decisions through learning from what has and hasn’t worked in previous investment rounds. This will mean developing a gradual approach and bringing appropriate change with us as we extend a wider reach. Even a gradual approach will involve uncertainty, while at the same time it is unlikely to be without critics.
Several weeks ago we released draft principles that will guide how the ABSF will be managed. These will look relatively high-level but the disparate nature of the SME lending sector means that prescriptive rules such as minimum standards may inadvertently rule out participants that we would otherwise have wanted to deal with. What they should signal though is an underlying focus on the market development role we are taking to be of prime importance.
Thank you.

