Issue 11 | AOFM Investor Insights | December 2022 | PDF
Introduction
This edition of Investor Insights is on the AOFM Secondary Market Turnover Survey. The AOFM has collected secondary market turnover data from AGS market makers since July 2016. Before the survey’s introduction, the AOFM did not have reliable data on secondary market activity in AGS markets. The survey design allowed the AOFM to specify the frequency of data collection, the categories of data, how the data is reported to the market, and how the AOFM provides feedback to market makers on their secondary market activities. This was a big project for the AOFM and the market. Asking all the major market makers to commit to completing a detailed survey each month (with a 100% response rate) was a significant achievement that has had long-term benefits.
The turnover survey provides insights into trends in secondary market activity, investor and market maker participation and support for investor engagement. Secondary market turnover is an important indicator of market liquidity. The main features of the AGS market that support and significantly add to liquidity include the following:
- The size of the bond market and the individual bond lines.
- The size and diversity of the investor base.
- The number and quality of price makers.
See Investor Insights Issue 5 – Liquidity of the Treasury Bond Market, for an in-depth look at AGS liquidity.
In 2021-22, 19 price makers provided secondary market turnover data.[1] Respondents provide aggregate monthly data on their sales and purchases of each bond line. The information includes the volume of trades, the number, and the counterparty category. The AOFM publishes gross turnover data quarterly, grouped by tenor and category.[2] Treasury Notes turnover is also surveyed but is not published as the secondary market for Treasury Notes is much smaller.
Key benefits of the survey
- Good measure of trends in overall liquidity in the AGS secondary market.
- Comprehensive coverage of secondary market turnover.
- Allows the AOFM and the market to assess and monitor trends in turnover by:
- Security type (Treasury Bonds, Treasury Indexed Bonds)
- Tenor / line
- Categories and regions
- Time periods.
- Allows the AOFM to assess market makers’ ability to distribute bonds to end investors.
- Assists the AOFM with its investor engagement activities.
- A report is provided to survey respondents on their secondary market activity and their activity relative to other market makers.
Trends in secondary market turnover
A significant benefit of the survey for the AOFM is the ability to monitor turnover trends and better understand how market conditions and dynamics can influence turnover and liquidity.
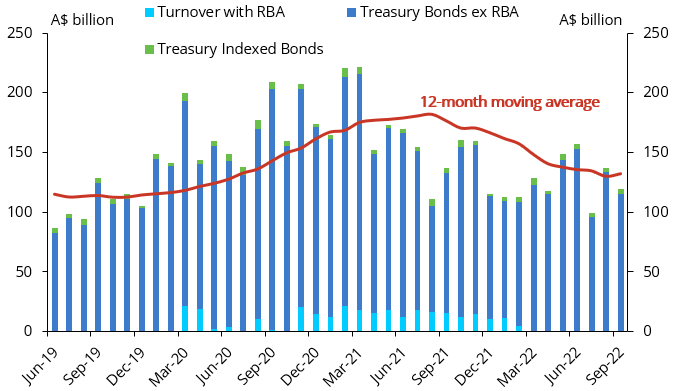
Chart 1 shows the monthly secondary market turnover for Treasury Bonds and Treasury Indexed Bonds since July 2019. Secondary market turnover for Treasury Bonds is much higher than for Treasury Indexed Bonds – this reflects the much larger market for Treasury Bonds, a more extensive and diverse investor base, and a greater number of active price makers.
Chart 1. Australian Government Bonds monthly turnover
The most recent monthly turnover update for the September 2022 quarter shows that monthly turnover has trended lower over the last year. After reaching record-high levels in early 2021 (spurred by high rates of AOFM issuance and turnover created by the RBA’s bond purchase operations), secondary market turnover in Treasury Bonds fell steadily for the first time since the AOFM began collecting data.
Turnover by maturity tenors
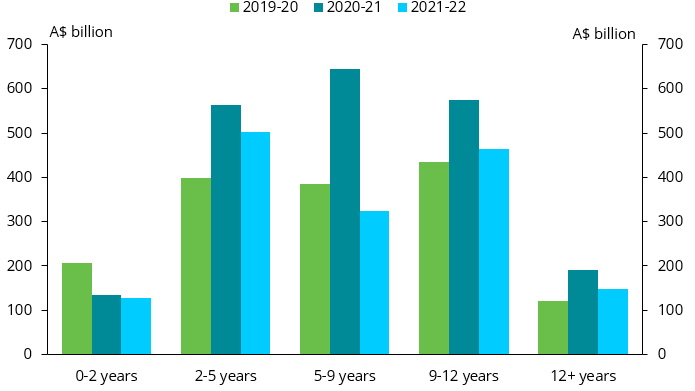
The AOFM publishes turnover data by tenor groupings. Treasury Bonds with tenors between 2‑5 years and 9-12 years exhibit the highest turnover volumes – these bonds underly the liquid 3‑year and 10-year Treasury Bond futures contracts.
Chart 2. Turnover by tenor groups
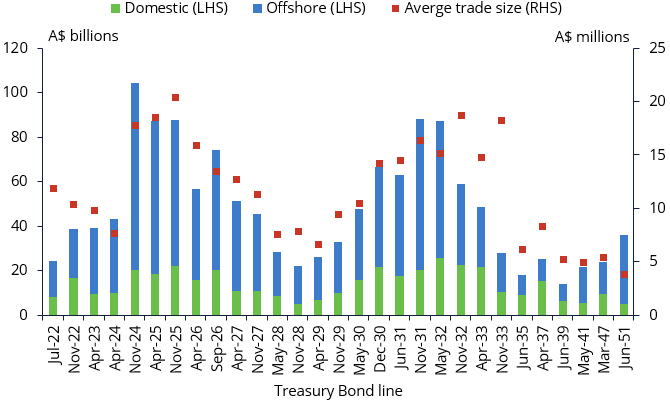
Since July 2021, AOFM has also collected turnover data for individual bond lines, providing more granular detail. Chart 3 shows turnover by bond line, excluding interbank and RBA. Separating interbank and RBA turnover gives a clearer picture of investor activity.
There are clear maximums around 3-year and 10-year basket bonds. In addition, average trade sizes are also much larger for these bonds – this reflects the ease of trading these bonds in larger sizes for investors and market makers. Lastly, Chart 3 also shows that for the period the majority of turnover (excluding RBA and interbank) was with offshore counterparties (blue bars).
Chart 3: Turnover by bond line, excluding interbank and RBA (July 2021 to September 2022)
Notably, the longest bond, the June-51, had the highest proportion of offshore turnover (86%). The following section examines the turnover categories in more detail.
Turnover by counterparty
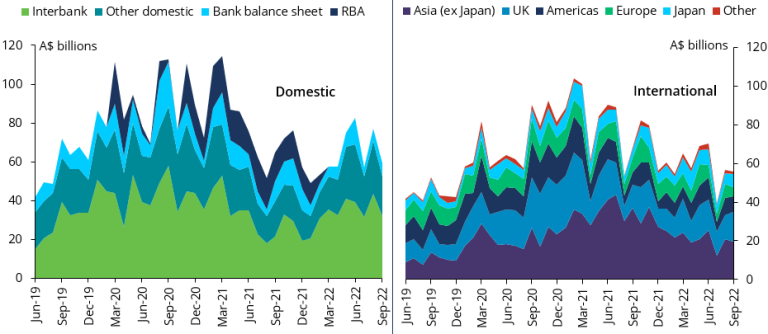
Market makers provide turnover for specific domestic and offshore categories. The domestic categories include interbank (trades between market makers), bank balance sheets, other domestic (primarily fund managers, insurance, and superannuation funds), and the RBA (since March 2020). Turnover with the RBA was captured in the ‘Other domestic’ category before March 2020. The offshore category is segmented by region rather than specific investor types. It includes Asia (ex-Japan), the UK, Europe, the Americas, Japan, and other international investors not in those geographies.
Chart 4 shows that interbank turnover is usually the highest domestic turnover category.[3] High interbank turnover is a good indicator of overall liquidity as it demonstrates that market makers have the confidence to short bond lines or to take long positions.
Chart 4. Gross turnover by category
Asia ex-Japan has consistently had the highest turnover for offshore turnover by region. AOFM’s extensive knowledge of the Asian investor base is that turnover is broad-based and comprises large numbers of official money investors, asset managers, and hedge funds. The UK, Europe, the Americas, and Japan are also significant regions. The data shows that around 70% of turnover for the period was transacted with offshore investors. This accords closely with non-resident holdings as a proportion of the free float of Treasury Bonds on issue, which is around the same level.
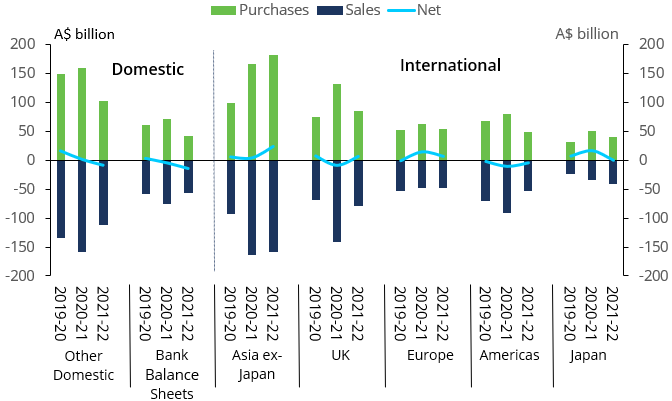
Chart 5 demonstrates that purchases and sales are relatively balanced across each category. However, there are times when certain investor types or regions may be selling more bonds than buying. For example, domestic bank balance sheets in 2021-22 reduced their overall holdings of AGS as their deposits with the RBA (exchange settlement balances) increased. Having a diverse and wide-ranging set of investors minimises the risk that all investor groups will respond to market conditions similarly.
Chart 5. Net investor turnover by category
Indicators of market health
The turnover survey provides the AOFM with a good gauge of the market's overall health aside from just the level of secondary market turnover. A feature of the Treasury Bond market is the large number of intermediaries that participate in both the primary and secondary markets. Participation by individual banks varies over time in both the secondary and primary markets, but no one bank dominates turnover in all regions. Each year the AOFM sends each bank a report comparing their secondary and primary market activity relative to other market makers. This provides banks with valuable feedback on their performance.
Chart 6 shows that the Treasury Bond turnover market share has been relatively constant over the last three years. The top three banks average just over 40% of turnover and, the top 10 around 90%. Even outside the top 10 banks, there is still a consistent activity level. Of the top five banks by turnover in 2019-20, only three were still in the top five in 2021-22.
Chart 6. Proportion of Treasury Bond turnover by top banks
Support for investor engagement
The turnover survey also assists the AOFM in its investor engagement activities. While it does not provide direct information on individual investor activity, it offers valuable trends in understanding investor activity by region. The level of turnover by price makers in different regions can be a factor in determining which banks could arrange investor meetings in certain areas. Lastly, the ability to distribute bonds to end investors is one of several considerations in determining the composition of dealer panels for syndicated issues.
Summary
Secondary market turnover is an important demonstration of the continuing deep and liquid AGS market. It is a valuable indication of ongoing or changing trends in liquidity and composition within this market. The design and successful implementation of the survey was a significant achievement for the AOFM and the participating market makers, which has had long-term benefits.
[1] A list of active market makers for Treasury Bonds is provided on the AOFM website https://www.aofm.gov.au/securities/treasury-bonds
[2] The survey results are published in the ‘Data Hub’ under ‘AGS Secondary Market Turnover’ https://www.aofm.gov.au/data-hub
[3] For reporting total turnover, interbank turnover is halved to avoid double counting.

