Australian Business Economists luncheon | Sydney
Rob Nicholl, CEO
To start I would like to acknowledge the Gadigal people of the Eora nation as the Traditional Custodians of the Land on which we meet today. I would also like to pay my respects to their Elders – past, present, and emerging.
Thank you again to the ABE for arranging this session – each year it provides opportunity to share insights from an AOFM perspective, the aim of which is to promote a better understanding of what motivates our behaviour. I am aware there is a fine line between wanting to emphasise what is important to AOFM through its broad decision criteria, while not wanting to send signals that at times could be misconstrued as reflecting specific decisions or impending actions. There will also be times of course when our thinking on something changes and we need to communicate that clearly. Having watched central banks with their communication challenges, it is clear the market communication task requires increasingly careful thought and crafting. The risk of underperforming with messaging feels elevated and potentially unforgiving.
There are three things I will cover today: first is a recap from last year on the cash portfolio management task and how this continues to impact our issuance behaviour; second, some thoughts on the year ahead; and third some observations on market risk and its relevance to the AOFM.
Over the last decade markets seem to have adopted as a comfortable norm low volatility and an expectation of ongoing central bank intervention in various forms (with the two being linked of course). But there haven’t been two consecutive years in recent times, at least from an AOFM perspective, that have seriously challenged that outlook. 2020-21 was a standout not just for the absolute size of the issuance task but for the frequency of revision. From our perspective most of the year revealed how difficult fiscal forecasting has been. As this year comes to an end, we find ourselves in a similar position.
Recall that, except for the volume, type and timing of AGS issuance, all Budget related flows are outside AOFM control. Nor are fiscal forecasts a product of any input from AOFM – so this puts most influences on AOFM decisions regarding the pace and timing of issuance also beyond our control. As to deviations from forecasts, these occur regularly although in the past this hasn’t usually given rise for the need for us to respond immediately or significantly (even in the near term). Only where variations to forecast are material, persistent, or both do we need a within year or between update guidance response.
Our efforts to run generally leaner cash balances this year (compared to a far more conservative plan last year) have been thwarted by persistent revenue strength relative to forecasts. And the flexibility we engaged through varying the weekly issuance was exhausted by quickly reaching our minimum commitment in Treasury Notes outstanding and reducing bond issuance to a balance between regular supply sufficient to support market functioning, while trying to remain in touch with our most recent guidance. Had cash holdings been more closely aligned to our cash management plan we would have varied the use of Treasury Notes markedly throughout the year. Instead, we have been sitting at or near the minimum for quite a while.
As this year closes we are more than just comfortably ahead of required issuance, with Department of Finance Budget monthly updates showing that by May the deficit was tracking around $25 billion lower than the most recent forecast.
Including an AOFM decision to go into 2022-23 with about $15 billion in pre-funding, the adjustment to required gross issuance this year from these changes so far represents around a quarter of the proposed program that accompanied the initial 2021-22 Budget announcement.
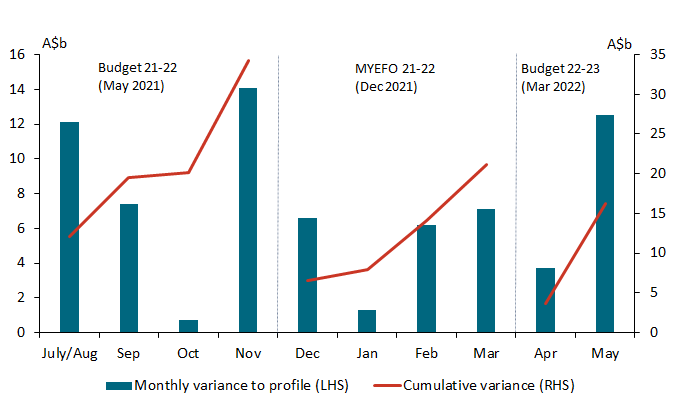
Chart 1: Receipts relative to Budget profiles (current year)
Source: Department of Finance, Australian Government General Government Sector Monthly Financial Statements
This chart shows monthly differences in revenue receipts against the profiles we are given to plan cash portfolio management using bond and Treasury Note issuance to meet cash needs and fund the deficit.
You can see three panels - each representing a different period within the year and each period with a forecast reset at its commencement – this means that you can’t simply add the cumulative variations for each period because the forecasts are reset for each period. The first thing to note is that there are no months in which receipts were lower than forecast.
Looking at the left-hand panel, this shows the difference in receipts compared to the forecast profiles for the period between the start of the year and MYEFO. Reading from the left-hand scale: in July/August receipts were about $12 billion ahead; in September about $7 billion; October a bit less than $1 billion ahead; and then in November alone they were about $14 billion ahead. For the period they were just over $34 billion ahead.
The changes are lower for successive periods, but the pattern is similar. I haven’t included changes to outlays, which can reinforce or offset revenue strength. That would unnecessarily complicate the message and revenue strength is the main driver of change anyway. However, it should be clear that calibrating issuance while balancing consistency with official forecasts and announced issuance guidance remains challenging. Fortunately, the current pressure is for lower-than-expected issuance and not a repeat of 2020. A few weeks back I shared this story with sovereign colleagues at an OECD steering committee only to find our experience was common rather than an outlier.
In 2020-21 there was a lot of uncertainty as to where the financing task would finish, due mostly to the trailing impacts of the pandemic, although for the better part of the year market conditions were stable. This year there has been the reverse: greater confidence that the trailing fiscal impacts of the pandemic have been better anticipated; but is a year characterised by extreme market volatility and a large sell-off.
And while we have stepped back from more prescriptive guidance on issuance rates through the year, the experience of the last two years now has us considering options as to when gross annual issuance guidance should be initiated and then updated so as to take account of the most recent information. But for now, we will continue the recently established practice of announcing new maturities in July and January, and we will continue to refrain from providing planned or expected weekly issuance rates.
I will now turn to some comments on the year ahead.
At present the most recent Budget announcement is well behind us and a new Budget is to be handed down again in a few months. But until new forecasts are released, we are using current guidance of around $125 billion in Treasury Bonds on which to base the 2022-23 issuance strategy.
As for linkers, there is little, if any signal for us to adjust the year-to-year outlook of around $2.5 billion through regular tenders. Recall that the AOFM resumed issuing inflation-linked bonds in 2009, following a long hiatus. It was felt at the time that the linker market could be a useful source of funding and be used to diversify the investor base. As the years have passed and the total stock of debt increased, the linker market has not played that role. By far the bulk of our financing tasks have been met via Treasury Bond issuance, as have large swings in issuance when required. However, with regular issuance we continue to support the ongoing operation of that market on what we think of as a ‘do no harm’ basis. In the meantime, it remains a market that predominantly attracts domestic investors, including superannuation funds.
Our consistent approach sees the AOFM issue linkers across breakeven cycles: so, we could not be characterised as an ‘opportunistic’ issuer. The coming year, as per past practice, will involve regular issuance, but having established the 2032 earlier this year it will be a while before another new maturity is considered.
Treasury Bond issuance for the coming year will take account of debt (rather than cash) portfolio considerations and the formulation of a debt management strategy each year is to guide us in that task is standard practice. In the last 8 years a debt management strategy has taken the form of one number – the weighted average term to maturity (or WAM). In the distant past we constructed strategies that allocated varying proportions of the planned gross issuance program into different sectors of the yield curve. But a WAM removes the arbitrariness of false precision and gives us broader flexibility throughout the year to change issuance as required according to prevailing market conditions.
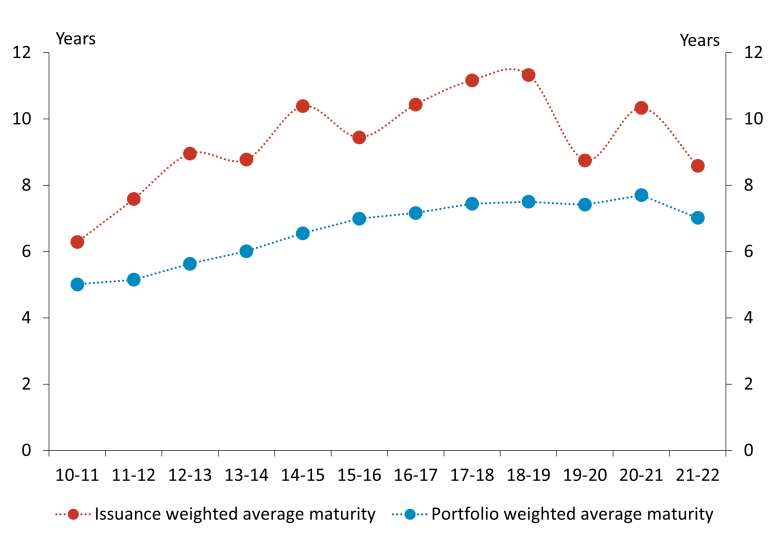
Chart 2: Weighted Average Maturity: Issuance (red) and Portfolio (blue) (2010-11 - 2021-22)
Source: AOFM
As this chart shows, for many years changes to the debt management strategy have reflected extending the yield curve to include a 30-year maturity. And although the issuance strategy for 2019‑20 was abandoned in March that year, we did set one for 2020-21 (which was at least 10 years and met) and then again for this year (which was at 8.5-9.5 years, this also having been met at the lower bound).
We don’t announce a forward strategy because rather than provide external value, it could create confusion and distraction given there are many ways to achieve it. That’s why we refer to “issuance behaviour like, or higher or lower, to last year” when asked. This aims to convey an expectation that behaviour on average will be familiar, or comparable, rather than getting caught in anticipation and explanations about detail that will undoubtedly change as the year progresses.
Prior to this year we had looked to the WAM almost exclusively for achieving portfolio management objectives. But for this year and next year at least we will need to take account of the possibility that shorter bond lines will attract more than usual issuance attention.
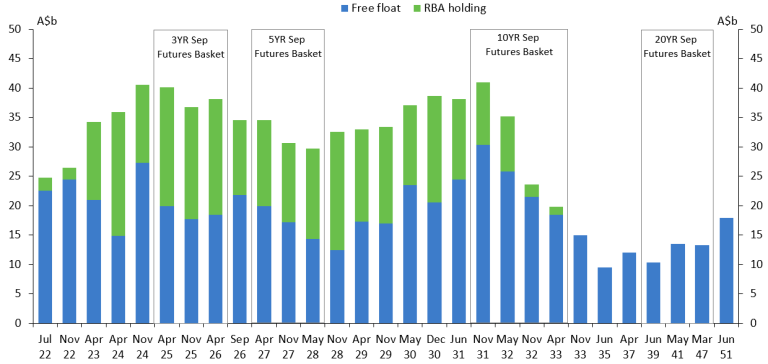
Chart 3: RBA holdings versus 'free-float'
Source: AOFM, RBA
This chart should be familiar; it shows that following the end of the RBA yield targeting, market clearing, and broad bond buying operations it has been left holding large proportions of many bond lines. Therefore, next year there is a strong chance (as I just said) that market functioning will at times dictate issuance decisions over portfolio aims.
Strategic issuance choices in the debt management strategy are a key means by which the AOFM manages cost and risk. Balancing those costs and risks through the formulation of an annual strategy involves judgement.
The potential cost implications of our choices are assessed by considering a range of future scenarios. Risks to debt servicing costs are considered asymmetrically – that is, we want to avoid extremely adverse cost outcomes rather than to seek outcomes that aim only to minimise costs but come with higher risk. The consequences of issuance strategies in low probability but high impact scenarios are also considered (for example a sudden withdrawal of investor demand for AGS, or a large spike in government financing needs or bond yields).
Risk considerations will typically dominate cost considerations when annual issuance tasks are high in the near-term (and even more so if they look to be increasing). In these circumstances, a long-dated issuance bias is prudent (to reduce future refinancing risk). However, higher than normal short-dated issuance may be appropriate if there are overriding considerations. One such consideration could be prolonged poor functioning of the short‑end due to the trailing impacts of monetary policy operations. In this regard our issuance decisions could help to facilitate a smoother transition toward more normal market functioning, although we can’t be expected to recalibrate all these dynamics. Other indicators for shortening issuance may be periods of market stress (where for example investor appetite for duration risk is sharply and broadly reduced), or if we see the emergence of a persistent and noticeable term premium.
When issuance tasks are lower and forecast to fall, the balance of considerations will shift from reducing risk to reducing expected costs.
The AOFM has no control over the outright levels of bond yields and no comparative advantage in predicting future yields. And although we constantly monitor the steepness of the curve in different sectors, and regularly assess whether a term premium is present, we can’t be sure that either observation will hold throughout the year. However, if bond yields are perceived to be particularly low it may be appropriate to bias issuance longer. On the other hand, it is generally unwise to concentrate issuance into short-dated bonds and deliberately increase refinancing tasks in coming years because prevailing longer-dated bond yields are perceived to be high.
What the AOFM does have control over is the number, size, and maturity structure of outstanding bond lines. We also, to the extent prevailing market conditions allow, have a lot of control over weekly issuance choices. Decisions around bond lines are made with the aim of facilitating efficient market operations. To this end, supporting the three and ten-year futures contract through establishing new maturities and ensuring large liquid bond lines for the underlying futures baskets has been an obvious priority. Over time this approach should make AGS more attractive to investors, which in turn helps to reduce debt servicing costs and maintain ready access to funding markets.
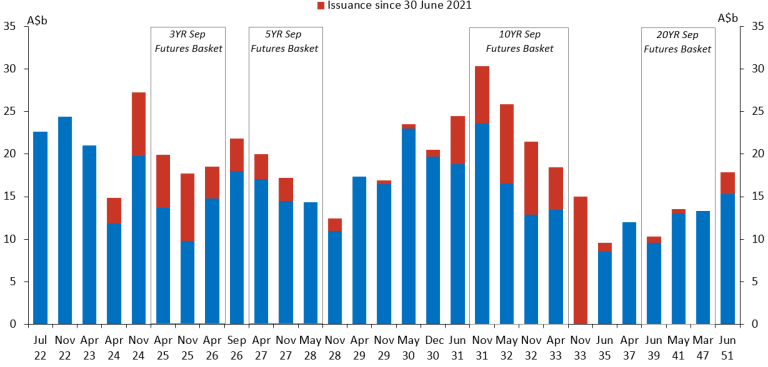
Chart 4: Treasury Bonds issuance activity for 2021-22
Source: AOFM, RBA
This chart shows Treasury Bond lines net of RBA holdings – in other words the blue and red bars together show the ‘free-float’ for each maturity, with the red bars indicating issuance activity for this year. You can see that we have been active in the short end. It also to highlights how important the 10-year futures part of the market is for us to achieve issuance volume. The new 2033 maturity will contribute to supporting the 10-year futures contract, and consistent with a clearly established pattern new 2034 maturities can be expected for the coming year.
Last year I specifically made mention of how we viewed development of the ultra-long end of the yield curve. Apart from reference to maturity gaps between successive 30-year benchmark bond lines, I highlighted consideration of maturity gaps between the 2041 and 2047 lines. I did that because the 20‑year part of the yield curve hasn’t, at least in our view, developed as a clear point of strategic interest. Even with the US recommencing new 20-year bond lines there doesn’t appear to be any traction for the idea that this part of the yield curve is of any more market interest than say 7 or 15 years. This looks to be the case for most comparable sovereign markets. Another year of observation has only entrenched this view and as such we have decided that no more new maturities are needed around the 20-year point of the AGS curve. In view of that we have abandoned a previous plan to establish a new 2043 or 2044 maturity because we don’t require new 20-year maturities from a portfolio management perspective. However, we will continue to tap existing lines anywhere in the ultra-long part of the curve when the opportunity arises and there are no meaningful constraints as to how much we can respond to indicators of demand.
As I said last year, our focus now is on supporting ultra-long bond lines through more regular tenders. This chart shows that four of the six ultra-long lines were tapped this year – most on several occasions. We have done this in favour of the pivot away from the use of syndicated taps as advised last year.
In the AGS market demand for bonds underlying the 3 and 10-year futures baskets remain the predominant points of consistent demand. But we are also seeing the 30-year point on the curve become a distinct point of interest. This has only served to reinforce our view that regular replacement of the 30-year benchmark bond will be important. The decision as to when the next 30-year bond should be established hasn’t been finalised but three considerations remain: (1) allowing sufficient time for any 30-year maturity to be built to a liquid level (and hence for it to attract solid interest); (2) launching at a bit longer than 30-years, which seems to have attracted market support; and (3) not allowing it to become too short so as to undermine its role as a true 30-year benchmark.
I will close with a few comments in market related challenges and risks relevant to our considerations. In highlighting these though I am not suggesting that they or other risks pose significant market threats to completing next year’s issuance program. In fact, the underlying demand for AGS appears solid. But we can’t ignore the possibility that with an outlook for continuing material adjustments across financial markets further periods of heightened volatility and market stress are likely to emerge.
With that in mind we are prepared for periods when issuance is harder to get away. However, we have a lot of flexibility in how we conduct the overall issuance task and remain well-placed to use that flexibility.
Three things dominate our thinking.
First and most obvious is the potential for heightened and prolonged inflation. With the impact of continued inflation, we see several potential transmission mechanisms. One is that nominal bonds become less attractive during outbreaks of persistent inflation. Offsetting this could well be that bonds generally will play a greater role in portfolios if economic recessions emerge. Another transmission will be through monetary policy responses via cash rate changes, a cessation of QE and the possibility of QT programs. It is difficult to foreshadow the impacts of QT. Taking the US Treasuries market for example, the last time this was attempted was with a deflationary backdrop and so very different to the present context. What we do know is that this is likely to narrow AGS spreads to US Treasuries and this will make AGS relatively less attractive on a yield basis; in addition there will be cross-currency and market liquidity considerations.
Furthermore, there is no general outlook for slowing sovereign issuance globally, so this is likely to exacerbate the QT effect. It is difficult to foreshadow how this might impact offshore demand for AGS, but again at the margin it could be through a loss of relative yield attractiveness. However, in a world of QT and rising yields this should in-principle underpin an increasing bid for high quality sovereign issuance (that is, the opposite trend from what we saw with falling yields and banking systems flushed with liquidity ‘pushing’ investors up risk and credit curves).
The second outlook consideration relates to deteriorating market liquidity. We know this has been happening broadly because we observe it in $US markets. There is more than one source of declining liquidity, and the coincidence of these factors creates the ongoing potential for high volatility to induce short periods of market dislocation. While not a concern for us getting programs funded it does present the possibility of periods where issuance choices are more constrained than usual. And while we are aware of this and can try to maintain behaviour supportive of market liquidity, the deeper causes are well beyond the ability of issuers to counter.
The third outlook consideration is more general but relates to anything that could severely disrupt the nature of our offshore investor base – which by all accounts has remained pretty much intact (both by geography and investor type) over the past 2 years. In fact, we are aware that the official money part of the investor base has broadened in recent times with some major new institutions having entered the AGS market. In any case the domestic bank balance sheets are also expected to again become a dominant part of the AGS investor base as they need to rebuild bond holdings to adjust their HQLA composition over the next few years.
In summary the year ahead looks to be far more business as usual in terms of issuance and improving Budget forecasts, but the backdrop of market conditions will present some challenging periods. After nearly 10 years of significant central bank asset purchases and the financial market behaviours that have been built around that it is hard to imagine that unwinding this, even partially, will not involve significant relative asset price readjustment on a broad scale. In fact we have already seen this underway with purpose. How far it goes and for how long it continues is difficult to forecast but what is likely is that it will continue to be associated with strong bouts of market volatility.


