Australian Business Economists luncheon
Rob Nicholl, CEO
To start I would like to acknowledge the Gadigal people of the Eora nation as the Traditional Custodians of the Land on which we meet today. I would also like to pay my respects to their Elders – past, present, and emerging.
Thank you to the ABE for organising this AOFM update. Consistent with how I have used this opportunity in the past I will give some insight into how we are thinking about the road ahead; but this year in particular it will be useful to do it in the context of observations from last year. A lot has happened since then although in some ways the uncertainty feels familiar.
The extent of uncertainty we faced for much of 2020 seems unlikely to be repeated this year, but markets are not lacking in potential triggers for renewed bouts of volatility. Creating operational flexibility has probably never felt so important, although as last year showed it is virtually impossible to know what specific challenges will feel large and when they need to be faced.
Today I will note several observations and changes from last year. But in doing so I will extend some of those themes and highlight additional changes for the year ahead. The way through this will also cover: what is influencing our view on issuance; changes to how we will approach issuance updates; and the ultra‑long end of the yield curve.
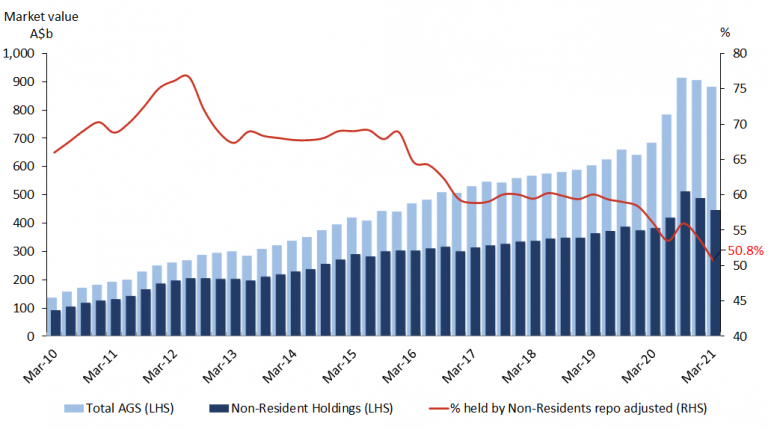
Something I flagged in the build-up to these large issuance tasks was hope for continued strong engagement from offshore investors. Although the proportion of offshore ownership had been gently declining since the first quarter of 2019, it began increasing again noticeably last year from around May (see Chart 1). Net offshore buying continued to increase until the proportion of offshore ownership peaked at about 56 per cent in the last quarter of 2020, bringing it back in line with levels prior to the March sell-off. Since then it has again been steadily declining, to a current level of around 51 per cent. Domestic bank balance sheets, which prior to March last year had been noticeably increasing AGS holdings, also materially increased purchases of AGS in outright terms from around May with their market share rising from 20 per cent to a peak of around 25 per cent towards the end of calendar 2020. However, bank balance sheets and offshore investor peak positions have unwound noticeably, this commencing around the time of the RBA’s broad bond buying program in late 2020.
Chart 1: Resident and Non-resident holdings of AGS
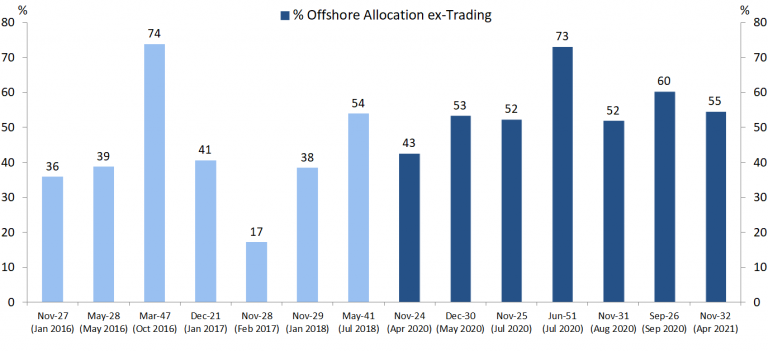
A contributing factor to the strong net offshore flows was a strong representation in syndications last year. On average over half of syndication allocations went to offshore investors (the darker bars to the right in Chart 2). Although not shown on this chart, domestic bank balance sheets were also prominent in syndications and as a group they had allocations on average of around 17 per cent, which is notable given the relatively small number of them.
Chart 2: Syndicated bond deals – offshore allocation
The strength of offshore participation was also helped by the return of Japanese investors, with substantial net flows increasing month-on-month throughout last calendar year and remaining relatively consistent into this year.
Another important observation from last year is that the AOFM needs a reliable way to ‘buy time’ for a catch up from slowed or suspended issuance if funding markets close temporarily. A sizeable cash buffer, while sitting unused most of the time, is that necessary backstop. And although the Government holds considerable financial assets across a range of investment funds, the only financial assets available to meet the Government’s cash needs in a crisis are those held with the RBA on behalf of the AOFM.
Cash balances were recovered and then reinforced in anticipation of further borrowing challenges throughout last year by maintaining a high tender issuance rate, complemented by large syndications. Issuance last year wasn’t just about managing a fixed financing task with the usual degree of confidence in revenue and outlay forecasts, it was about being as aggressive as possible to get well ahead, and to stay ahead. Of course there were other considerations, such as managing a potential build-up in refinancing risk, supporting the futures contracts, and responding to specific demand to support liquidity, but these played second fiddle to getting ahead and staying there.
The cash position as regularly reported on the AOFM website has in recent times attracted greater than usual attention, with some observers having put considerable effort into using these in attempts to interpret what we were doing, or are about to do. But this will remain a fraught exercise because those balances reflect a wide range of underlying considerations and circumstances. In addition to a cash buffer, there are large scheduled outlays such as GST related and other transfers to the states, not to mention bond and Treasury Note maturities. Furthermore, significant timing mismatches between government inflows and outflows as part of the cash cycle cause large day-to-day variability in the cash position. Except for the volume and timing of financing flows from tender issuance and syndications, all of these are outside the control of the AOFM.
In addition, we face continued likelihood that revenue collections are running ahead or behind forecasts, with uncertainty as to how long such strength or weakness will persist. Outlays can change too but usually not to the extent we see variability in revenue inflows.
Taking recent experience as an example, when actual revenue is above forecast we can do three things: (1) nothing – which is the equivalent of letting the cash balance increase; (2) issue less Treasury Notes; or (3) slow the rate of bond issuance. Each of these comes with consequence.
The ‘do nothing’ option means more AGS on issue at times than required. Slowing Treasury Note issuance and allowing outstandings to fall raises questions about our commitment to the market. And on numerous occasions in the past we have formed issuance guidance to include a planned weekly issuance rate; and so, slowing bond issuance would at some point look inconsistent with the most recent guidance.
Another thing to bear in mind is that changes to the financing task are a product of changes to two very large numbers, government revenue and outlays, both of which dwarf the issuance program.
For example, the 2021-22 forecast net financing task is about $100 billion. However, if the Budget forecasts for both revenue and outlays prove to be optimistic by say 5 per cent, our net borrowing requirement would increase not by 5 per cent but by closer to 50 per cent. So actively managing the issuance task while keeping to market guidance is done within relatively tight constraints, not the least of which is a focus on announced gross issuance plans. But having reflected on important observations from last year we believe some changes to our guidance are warranted and I will highlight two of these.
First, in our attempts to keep the market readily informed last year there were times when we reduced flexibility by providing a lot of detail on issuance rates and planned new maturities. The former left us feeling hemmed in at times when better than forecast Budget performance created unplanned strength in the cash position. As it turned out, this left us with having announced materially higher weekly issuance rates than required.
Announcing all the new planned maturities in advance aimed to credibly indicate how the overall program would be managed, but this underpinned constant expectation about timing for the ‘next’ syndication. Therefore, forward announcements tended to ‘hang over’ the market at times, creating drag rather than support.
This has prompted a step back from the more prescriptive guidance we have given in the past. While we will continue the practice of announcing a planned gross issuance program at Budget for the year ahead, details about planned new maturities will now be announced in two stages: in early July; and again when issuance resumes in January after the Christmas break. Updates on planned gross issuance for the year will continue as per past practice at MYEFO and the following Budget.
We will also refrain from providing expected weekly issuance rates to give more flexibility. We understand that these changes will require trust in how we exercise that flexibility but are confident that over time these changes will prove sensible.
The second thing to highlight is our use of Treasury Notes. It has been difficult over the last year to plan for steady issuance. Two years ago we foreshadowed a relatively heavy reliance on Treasury Notes in line with more active cash portfolio management. Fortuitously, that intention paved the way for us to quickly and materially ramp up Treasury Note issuance from the end of last March.
There were times throughout the year when we clearly signalled the possibility of maintaining Treasury Notes outstanding more than $60-70 billion. This was because at the time we lacked clarity on: (1) whether the forecast financing task could be smoothly achieved with term issuance alone; or (2) whether further material increases in the financing task would emerge. Last year I said that we don’t provide guidance on Treasury Note issuance to avoid locking in an overall mix of funding – especially when there is the potential for material changes in the underlying Budget forecasts. I also said that Treasury Notes would continue to play an important role into this and next year at least. Both of those observations remain valid.
The variability in monthly Australian Government Bond (AGB) issuance since March last year can be seen from the blue bars in Chart 3. These are overlaid by the total volume of Treasury Notes outstanding at the end of each month – the red bars. Adjusting Treasury Note issuance offers important flexibility.
Remaining active in the Treasury Note market will allow us to better manage balances throughout the cash cycle. This will in turn facilitate a lower level of total AGS outstanding on average.
Chart 3: AGB issuance and stock of Treasury Notes
In terms of guidance, we remain reluctant to reveal specifics because experience suggests this will only lead to a fixation on levels and limits, and our plans will inevitably change through the year. But what I will say is this: an overall issuance program has been planned to accommodate a floor in Treasury Notes outstanding, and this will be in the vicinity of the current level shown in the chart; and issuance will be weekly (except for the Christmas shutdown). The important thing to note, however, is that our planning requires a variation in issuance rates throughout the year and to meet changes in the cash cycle.
Turning to other topics, we are frequently asked if the RBA’s operations influence issuance.
First, leading into last year the RBA and AOFM were active in buying back short‑dated bonds directly from the market. At times we have also bought stock back from the RBA. But reinforcing previous advice, the AOFM part of those operations will remain suspended until the end of 2021-22 at least, at which point we will again review the situation.
Second, we have taken the decision not to issue into bond lines that form part of the RBA’s yield curve control operation. We don’t rely on this part of the curve to achieve our borrowing requirements and to issue into these lines at present could create the impression that AOFM issuance was in direct conflict with a specific monetary policy aim. This is confusion we can easily avoid creating.
Third, the RBA’s broader bond buying program has no direct bearing on our weekly issuance decisions, which reflect our issuance strategy and prevailing market conditions. In the past we have sporadically issued into demand for bond lines between the 3- and 10-year futures baskets, but this has typically been a relatively dormant part of the AGS market.
And fourth, last year we flagged the possibility of establishing new third maturities in some years as a way of accommodating large forecast issuance programs. While we haven’t completely abandoned this option, we don’t intend pursuing this in the foreseeable future. This is because issuance is forecast to decline over the coming years, and because of the impact the RBA’s bond buying program could have on individual bond lines. In this regard individual bond line sizes for the purposes of market liquidity will be viewed by us not as the gross outstanding amount but the amount net of what the RBA holds. For example, the November 2028 line has $31 billion gross outstanding of which the RBA holds $17 billion; this indicates a ‘free float’ of $14 billion. A lot of this line has presumably been offered to the RBA because it is relatively less valuable to investors than other lines. However, re‑emerging demand will be a signal for us to tap it again. How much issuance it will need to remain liquid is hard to predict, but that is not something we should focus on now or feel constrained by when this occurs.
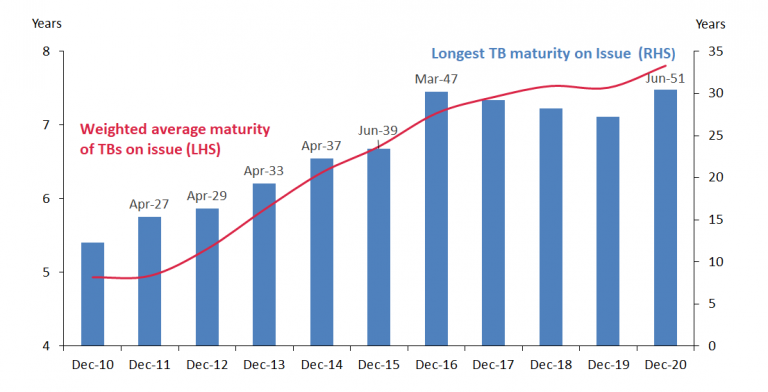
Now to some comment on the ultra-long part of the yield curve. Chart 4 shows the evolution of the yield curve extension process, beginning with the April 2027 to 15 years, followed by the April 2029, and then the April 2033 as the first 20-year maturity. Further extensions were incremental, with the April 2037 established in late 2014. The 20-year futures contract was launched in September of 2015 and very soon after we established the 2039 (another curve extension) in direct support of this contract. The 2047 was established about a year later as the first 30‑year benchmark bond line. Since then there has been a 2041 infill to support the futures contract and then last year the 2051 was the second 30-year benchmark bond line.
From 2011 to last year the curve extensions, together with a long issuance bias, including the use of tap syndications, have increased the weighted average maturity of the portfolio from around five to just under eight years (this is represented by the red line). That was all achieved when term premia were very low and the yield curve was relatively flat – or at least a lot flatter than it is now.
Chart 4: Treasury Bond curve extension
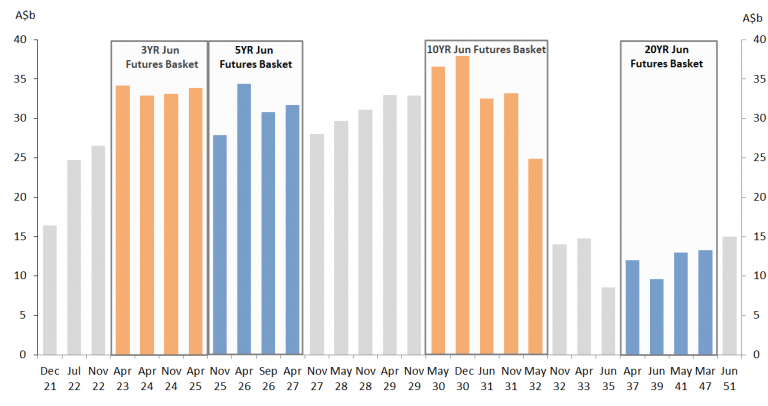
Chart 5 shows how support for the futures contracts has been structured and while there are existing bond lines that will roll-in to both the 5- and 3-year futures baskets, maturity gaps will need to be filled from time-to-time in support of the 10-year futures contract.
Chart 5: Treasury Bonds futures baskets
Two outstanding decisions remain. One is the maturity gaps between new 30‑year benchmark lines. This has not been decided and there is no urgency to this decision – having launched the 2051 bond another new maturity will not be under consideration for some time.
The other decision is how many bond lines are required between the 2041 and the 2047 bonds to round out support with infill maturities for the 20-year futures contract. We think one more maturity will fulfil that aim but whether that is a 2043 or a 2044 maturity we are yet to announce; that decision will probably have a bearing on whether the new maturity should be established in the coming year or the following year. With the 2047 and 2051 lines to roll down, there will be adequate support for the 20-year futures without the need for further infill maturities.
With the yield curve extension completed, ultra-long issuance will, from here on, be undertaken on a business as usual basis. You can interpret this as looking for opportunities to tap existing lines through appropriately sized tenders as demand arises.
I haven’t devoted much time to mention of the linker market because that has probably been the most straightforward part of our portfolio and issuance considerations in the last year. We are regularly engaged with this part of the market and continue to monitor dynamics to meet a broad undertaking to support it as appropriate. At present we do not assess a material imbalance between demand and supply but have often reminded investors that we have considerable flexibility to respond to obvious sustained change. It should also come as no surprise that a new in-fill maturity around the 10‑year part of the curve is under consideration, given this would be consistent with past practice. Should that proceed for the 2021-22 year it would be sensible to assume establishment by syndication and increasing gross issuance above the $2.5 billion already allocated for regular tenders.
Before summarising with some concluding remarks, I will make a quick comment on green bonds. This topic is being raised increasingly, both from offshore and domestic investors. Monitoring developments in so-called sustainable finance has been part of our watching brief for several years now. However, for us to make a case for green bond issuance based on cost, we need to be convinced that the additional costs would be more than offset by lower issuance yields. At this point we lack that conviction. First, it is not clear that we could consistently issue green bonds at significantly lower yields compared to a standard Treasury Bond. Second, a green bond portfolio would be small in the context of the total debt portfolio. This suggests that the impact on total public debt interest from a marginal yield advantage would be negligible. And third, we do not foreshadow the need for access to this market to meet our borrowing requirements, nor do we see a need for investor diversification that could only be derived from green bond issuance.
In short, our assessments are from a debt manager perspective and my message today is consistent with what we have been saying for a number of years: the decision to issue sovereign green, or social bonds for that matter, would be a policy decision by government and not something we could attribute to core debt management objectives. However, that is not the same as saying there won’t be debt management motivations for this in future; we just don’t see this at present.
Let me finish with some concluding remarks.
Last year offered the opportunity for first-hand experience in dealing with extreme financial market stress. While for our part there had long been plans in place to deal with loss of access to funding markets, most if not all elements of those plans were put to a meaningful test.
Furthermore, the balance between providing reliable issuance guidance and retaining flexibility has never been in such sharp contrast. The tension between operational flexibility and predictability, together with transparency, was also thrown into stark relief.
The things that worked well included an above average reliance on the Treasury Note market and the targeted use of syndications. I wouldn’t have thought prior to last year that there would be much, if any opportunity, to refine our thinking on these; but even tried and tested approaches need not remain static in a dynamic environment.
The year ahead while unlikely to present as much uncertainty as last year is not without the prospect for changes and volatility. Our experience from last year has heavily influenced an intention to generate more operational flexibility than we have looked to achieve in the past. We are mindful that some of these changes could come at the cost of what may look like less transparency in how we plan to engage with the market. Hopefully that is not the broader interpretation. It will also involve more variability in issuance rates than we have practiced in the past.
Thank you.


