Managing the Commonwealth's Net Debt Portfolio (PDF)
Introduction
Commencing in 1996, the Commonwealth began setting a duration benchmark on its net debt portfolio that encapsulated the desired debt portfolio characteristics, including expected cost and risks to this expected outcome. Through 1996 to 2002, the fiscal position of the Commonwealth resulted in an increase in asset balances and a reduction in short-term liabilities, leading to questions over the need for a Treasury Bond market. A review into the Commonwealth Government Securities (CGS) market was undertaken in 2002-03 to assess its future viability, and the likely effects were it to cease. The review concluded that the market was fundamental to an efficient functioning financial system through its ability to provide a risk-free benchmark. Furthermore, its removal would result in a slightly higher level of interest rates as financial institutions would incur greater costs in their hedging activities.
As future issuance was then determined with a view to supporting the Treasury Bond and Treasury Bond futures markets, meeting the benchmark became more complex and more reliant on interest rate swaps. The AOFM undertook a major benchmark review in 2003, and determined that the size of the term premium continued to justify targeting the portfolio’s duration at a level below that which arose from issuance alone. However, the repricing risk of the portfolio was also considered. To spread this risk over a few years, it was necessary for the AOFM to enter into interest rate swaps (swaps) to pay fixed rates with terms up to three or four years. Therefore, the portfolio management approach had evolved from one of managing to a duration target, to one of finding an optimal balance between increases in short-dated exposure[1] and reductions in duration.
The validity of this strategy rests on the existence a persistently positive term premium. However, over recent years, each of the AOFM’s annual benchmark reviews determined that the size of the term premium had been falling. This continual reduction removed the calculable savings expected through the existing portfolio management approach and ultimately led to the termination of AOFM’s interest rate risk management framework in June 2008. As a consequence, the duration of the portfolio would be allowed to follow from the outcomes of debt issuance. Following this decision, the AOFM began a process of unwinding its swap portfolio in November 2008. The program lasted for a period of six months, wherein the only swaps remaining at 30 June 2009 were those that were set to mature within 12 months and therefore carried very little interest rate risk.
With the removal of the benchmark framework that had existed in one form or another since AOFM’s establishment and the unwinding of its swap portfolio, it is timely to examine the lifetime reduction in debt servicing costs made possible through duration targeting and the Commonwealth’s use of interest rate swaps. Due to the absence of a clear counterfactual when issuance choices were flexible, the article necessarily focuses on domestic interest rate swaps and their effect on debt servicing costs in managing the Commonwealth’s Australian dollar denominated debt portfolio (the portfolio).
Setting a benchmark
Defining cost
In measuring cost outcomes, the AOFM places emphasis on accrual debt service cost. This measure of cost incorporates interest coupons associated with the portfolio’s physical debt and derivatives, realised market value gains and losses, capital indexation of inflation-linked debt and the amortisation of any issuance premiums and discounts.
Accrual cost is deemed the most meaningful cost measure in circumstances where financial assets and liabilities are intended to be held or to remain on issue until maturity and there is little likelihood that unrealised market value gains and losses will be realised. In these instances, the inclusion of changes in unrealised market value gains and losses would add a misleading level of volatility to debt service cost measurements.
Nevertheless, worthy information may still be deduced from measuring outcomes on a market value basis, for instance in evaluating financial risk exposures. To this end, since 1 July 2005 the AOFM has also adhered to the new accounting standard AASB 139 and has provided a comprehensive income presentation in its financial statements, whereby financial information is presented on both an accruals and fair value basis. This enabled AOFM to adhere with Australian Equivalents to International Financial Reporting Standards, AA31, whilst allowing stakeholders to ‘look through’ periods of market volatility in assessing cost outcomes. However, for modelling purposes in assessing the effect of different benchmark parameters on cost outcomes, emphasis remains on accrual cost.
From duration targeting to a target portfolio
The AOFM’s approach since 2003 has been to establish a model portfolio, or benchmark, that balances the expected savings obtained from having a portfolio with a low average term to maturity with the increased variability in cost outcomes this generates.
The process used to select the appropriate benchmark was to project a series of debt service cost outcomes under a set of baseline interest rate assumptions for a number of alternate portfolios. Various interest rate shocks and scenarios were subsequently applied and the impacts upon debt service cost outcomes measured.
The key risk parameters used to define the debt portfolio are modified duration and short‑dated exposure, as these parameters help to explain the majority of cost and risk behaviour for the portfolio. Modified duration is a measure of the sensitivity of the market value of the portfolio to a change in interest rates and is closely related to the weighted average term to maturity. Typically, portfolios with higher modified durations exhibit more stable, yet higher debt servicing costs over time than those with lower modified durations.
Short‑dated exposure is measured by allocating each cash flow within the net debt portfolio proportionally to the nearest two annual pricing points, and determining the share of the portfolio’s market value allocated to the zero-year pricing point. Portfolios with higher short‑dated exposures exhibit a greater level of variability in short term cost outcomes, as changes in market interest rates flow through to the portfolio over a relatively shorter period of time. The benefit, however, is that such portfolios will tend to demonstrate lower interest costs over time, assuming a persistently upward sloping yield curve, or term premium.
The AOFM determined the optimal trade-off between lower debt servicing costs and increased volatility in accrual cost outcomes. Subsequently, the AOFM undertook regular reviews of the benchmark portfolio in order to determine the validity of the underlying assumptions and would propose to either maintain or alter the existent parameters.
Once the benchmark had been approved, the Long‑Term Debt Portfolio (LTDP) was altered so that it more closely mirrored that of the benchmark. Given the relatively pre-determined issuance pattern, this was achieved through executing interest rate swaps, in particular:
- long‑dated interest rate swaps (of around 10 years maturity) in which the AOFM receives fixed interest rates and pays floating interest rates to match the maturity of the bonds on issue; and
- short‑dated interest rate swaps (of around two to three years maturity) in which the AOFM pays fixed interest rates and receives floating interest rates to match the maturity of the desired benchmark profile.
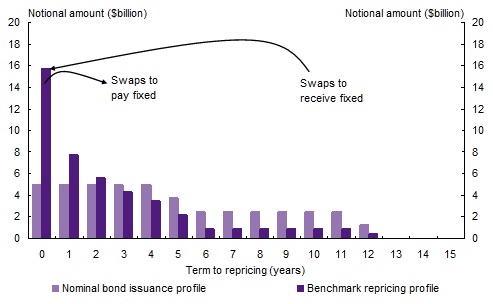
To illustrate, Chart 1 shows how using swaps in this manner combine to change the profile of a theoretical debt portfolio towards a desired benchmark. The schematic portfolio is one that would eventuate over time from bond issuance with maturities of five and 12 years. The long‑dated swaps reduce the portfolio’s modified duration, while increasing the amount of exposure to floating rates (and thus increases short-dated exposure). Whereas, the short‑dated swaps increase the amount of one to three year exposure while reducing the floating rate exposure (and thus decreases short-dated exposure).
Chart 1: Term profile before and after swaps
Ongoing reviews
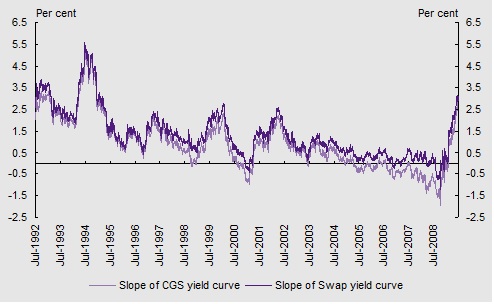
The AOFM established an annual benchmark review process to confirm the appropriate benchmark parameters regularly. As Chart 2 illustrates, yield curves flattened significantly after the 2003 review. This led to repeated revisions to the term premium which had a flow on effect to benchmark parameter choices. For further discussion on the changes in the term premium, see Responding to a Falling Term Premium.
Responding to a falling term premiumThe driving principle underpinning the selection of AOFM’s benchmark portfolio is the existence of a persistently positive term premium. The term premium is the margin over the implied path of cash rates that investors in long-term debt require to compensate them for bearing the market and liquidity risk associated with long-term debt relative to a series of short-term investments. In recent years, yield curves began to flatten and ultimately became inverted, as shown in Chart 2. This led to the AOFM reducing its estimate of the CGS term premium (10 year bond over cash) from 0.90 per cent in 2003 to 0 per cent by 2008. Similarly, the swap term premium (10 year swap over cash) estimate reduced from 1.35 per cent in 2003 to 0.45 per cent by 2008. Consequently, over this period there were upward revisions to the duration benchmark target. In the 2005 review, the duration target was increased from 2.0 to 2.5 years. This was maintained through 2006 until the 2007 review resulted in a target of 3.0 years. The reduction in the calculable positive term premium led the 2008 review to conclude that: • The estimated long run savings generated from the swap term premium estimate are unlikely to provide sufficient returns to compensate for the additional volatility in debt servicing costs; and • The lack of empirical evidence supporting a positive term premium in the CGS yield curve negates any potential benefit from shortening duration. In consultation with the AOFM Advisory Board, it was decided in June 2008 that unless and until market conditions normalised and a positive term premium re-emerged, the current benchmark and relative performance framework should be discontinued, with the portfolio no longer managed to a duration target. Chart 2: Slope of CGS and swap yield curves (10 year bond/swap less cash) |
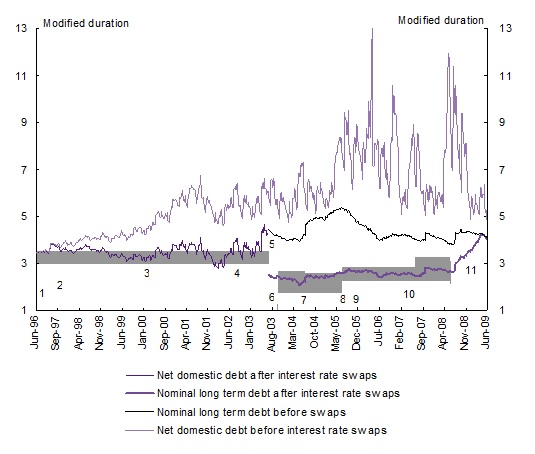
Chart 3 illustrates the modified duration of the domestic debt portfolio since 1 July 1996. Of recent note are the cessation of the interest rate risk management framework from 1 July 2008, and the subsequent upward trend in duration following the unwinding of the swap portfolio.
Chart 3: Modified duration of the domestic debt portfolio
Notes:
|
Performance of the program
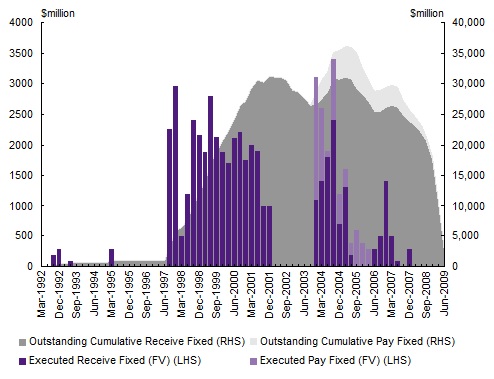
In order to align the debt portfolio closer to that of the model benchmark, a large volume of interest rate swaps has been required. Indeed, when the new framework was introduced in 2003-04, the volume of swaps required to alter the debt portfolio was too large to be realistically executed without causing market distortions. Accordingly, it was decided that a transition period of two to three years would be used to bring about this outcome[2]. The volume of swaps executed between 2003-04 to 2004-05 was therefore of similar size to that seen in the late 90’s where the AOFM was seen as a significant participant in the swap market.
In recent years, however, the volume executed has declined somewhat, whereas the swap market has continued to undergo strong growth. The last swap executed by the AOFM was on 15 November 2007. The volume of interest rate swaps undertaken (in notional face value (FV) terms) since inception is presented in Chart 4.
Chart 4: Interest rate swap activity
Interest rate swaps alter the portfolio’s debt servicing cost in three ways: directly, indirectly; and through revaluations.
- Direct effects relate to the difference between the interest receipts and interest payments on each reset date. This contributes directly to the operating result on the AOFM’s balance sheet.
- Indirect effects relate to the financing benefit or cost that accrues flowing from net interest receipts. Positive net interest receipts reduce the size of the net debt portfolio through increasing the investments held as term deposits with the RBA. Negative net interest receipts have the opposite effect.
- Valuation effects represent the unrealised changes in the market value of the swap portfolio. These capture the cost or benefit owing were the AOFM to unwind its swap portfolio at prevailing market interest rates. A consequence of the AOFM’s comprehensive income presentation is that debt service costs are reported on a pre- and post- revaluation basis. Accordingly, interest rate swaps to receive fixed rates thus have a dampening effect on portfolio performance when presented on a post re-measurement basis.
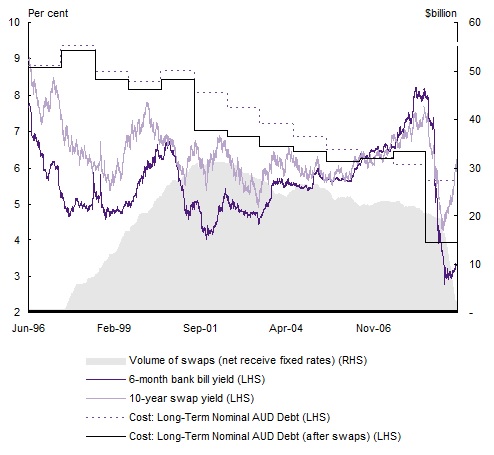
The impact of interest rate swaps on the debt servicing cost of the Government’s debt portfolio is illustrated in Chart 5. Commencing in 1996, the chart shows the percentage cost of funds of gross CGS debt in accrual cost terms (before revaluations) and the reduction in those costs through the direct savings from interest rate swaps. In all years except 2007-08, swaps were able to produce an effective cost of funds lower than had they not been present, however, the impact of swaps in 2008-09 is distorted by the crystallisation of what would otherwise have been unrealised profits in the swap portfolio.
Chart 5: Direct impact of interest rate swaps on effective cost of funds
With the introduction of the duration benchmark in 1996, the debt portfolio inclusive of TIBs, was managed to a duration target band of 3.0 to 3.5 years. From 1996 to 2000 the volume of swaps required to maintain this band increased significantly, due to the accumulation of the proceeds of both Budget surpluses and asset sales that had the effect of increasing the duration of the net debt portfolio. However, as short-term interest rates were also increasing in the period, the net result was that the cost savings were relatively stable from year to year.
In 2000-01, the cost of the debt portfolio fell significantly, due to large positive net interest receipts earned on the swap portfolio from the fall in short-term interest rates. Over the next several years the cost savings achieved through swaps gradually declined. In 2003, the AOFM conducted a major benchmark review, whereby the portfolio was split into a long-term debt component and cash management component. The duration target for the long-term debt portfolio was set at 2.0 years. As short-term rates increased, yield curves became flatter and eventually inverted. This meant that existing swaps were less valuable and the savings they afforded were reduced. In response, successive annual benchmark reviews steadily increased the duration target of the benchmark portfolio to be closer to that resulting from debt issuance alone.
The level of market interest rates resulted in swaps generating a net accrual cost of $180 million in 2007-08. Furthermore, the inverted yield curve diminished the prospect of cost savings available through new swaps, at least until the market began to price in monetary easing. No new swap activity occurred after 15 November 2007, and the volume of swaps held in the portfolio declined as individual swaps matured.
In 2008-09 the RBA undertook monetary easing, such that the cash rate went from 7.25 per cent in March 2008 to 3 per cent in April 2009. This sizeable turnaround in short term rates, coupled with the suspension of the interest rate risk management framework, left the AOFM with a significant legacy portfolio of swaps. As rates fell, this portfolio’s value increased and terminations were undertaken to crystallise that value, which can be seen as the large realised saving in 2008-09.
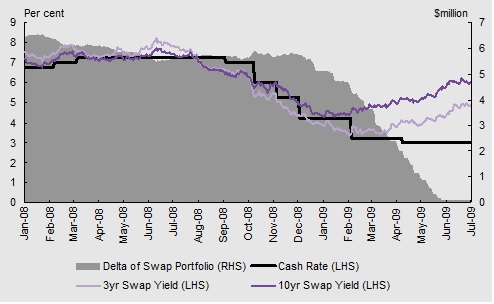
The termination of the swap portfolioWith the change in strategy that would see the debt portfolio’s structure follow from the outcomes of issuance and maturities alone, swaps became a legacy component of the portfolio from July 2008. The deterioration in financial markets that began in November 2007, ultimately led to a repricing of risk and a global easing in monetary policy. This contributed to a considerable turnaround in the market value of the swap portfolio - from June 2008 to October 2008, the change was in excess of $1.2 billion. This provided the AOFM with the opportunity to wind down its swap portfolio at a time that would be favourable for the Commonwealth. Accordingly, a program was devised and the AOFM announced in November 2008 that it would begin unwinding its swap portfolio. Initially, up to $4 billion was to be terminated in 2008-09. Unwinds progressed at a faster than expected rate and in February 2009, the $4 billion limit was removed and unwinds continued with no upper limit. By the end of May 2009 the only swaps that remained in the portfolio (a total of 23 at the time) were ones that would mature within 12 months; this meant the portfolio was subject to little remaining interest rate risk. It was therefore decided that the AOFM would allow these to mature and would cease actively seeking out terminations. Scope remained to entertain approaches from counterparties, but as at end June 2009, the AOFM had not been contacted by counterparties seeking to terminate these swaps. The unwind program saw a total of 130 swaps unwound ($15.25 billion notional), with a realised gain of $1.029 billion in favour of the Commonwealth. Of the 130 terminations, 12 occurred as part of AOFM’s credit risk management processes*, in the period 22 December 2008 to 3 February 2009, when credit rating agencies downgraded several swap counterparties to which the AOFM had exposure. As at 30 June 2009, the AOFM’s swap portfolio consisted of 21 swaps with a total notional principle value of $2.425 billion. Chart 6 shows the evolution of market interest rates since January 2008 in comparison with the reduction in the swap portfolio’s delta. As shown, unwinds proceeded at a solid pace during a period in which interest rates fell to historically low levels, thereby allowing unwinds to proceed on favourable terms for the Commonwealth. Chart 6: Interest rate swap unwinds* For the 2008-09 year, there were a total of 13 swap terminations undertaken in response to adjustments to credit ratings. The first occurred in October, prior to the commencement of the unwind program. |
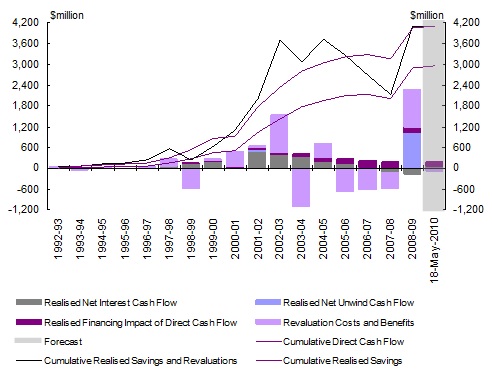
Chart 7 shows both the direct and indirect cost savings from interest rate swaps since they were first executed in 1992. The realised direct savings have grown to a cumulative total of $2.898 billion as at 30 June 2009. These savings were primarily invested in higher asset balances which generated additional interest revenue and further reduced the accrual cost (before revaluations) of the net debt portfolio. Including these indirect, or second round financing effects, the cumulative realised benefit over the period to 30 June 2009 has been $3.952 billion. The shaded area represents a projection for 2009-10, as the last swap matures on 18 May 2010.
Chart 7: Realised savings arising from interest rate swaps
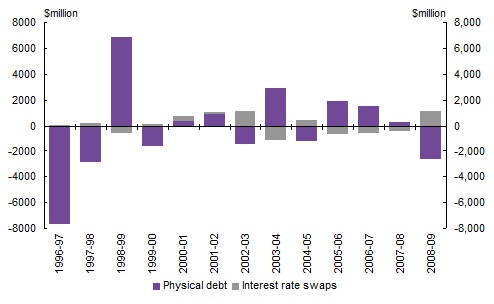
As the AOFM presents its portfolio performance on both a pre and post re-measurement basis, revaluation effects influence reported cost outcomes. Chart 8 shows the changes in the year‑to‑year revaluations of the swap portfolio, against those of the physical debt component. Revaluation effects on swaps are seen to typically offset those generated by the debt component and therefore reduce the influence that re-measurements have on mark-to-market performance outcomes of the net debt portfolio.
As Chart 8 shows, there is a degree of variability in the year-to-year market values of swaps owing to changes in interest rates. The management approach adopted by the AOFM places more emphasis towards reducing the medium to longer term costs of the debt portfolio, rather than minimising year-to-year revaluation effects. As such, the AOFM uses interest rate swaps as a portfolio management tool rather than a trading device used to extract maximum market value through liquidating existing swaps during troughs in interest rate cycles and replacing them during peaks.
Chart 8: Revaluation costs on interest rate swaps
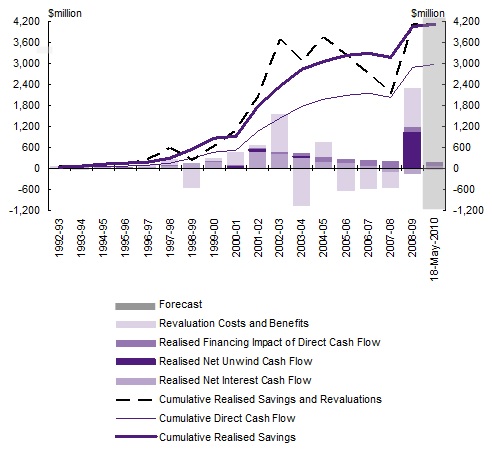
Combining direct, indirect and revaluation effects, the total lifetime economic value provided through swaps is presented in Chart 9. The chart shows that while the effects of revaluations have varied, there has been a steady increase in the cumulative realised performance. As at 30 June 2009, swaps had generated a total economic saving of $4.019 billion. The ultimate financial consequence of the Commonwealth’s interest rate swap strategy will not be known with certainty until the last swap matures on 18 May 2010, however, with only 21 swaps remaining in the portfolio at 30 June 2009, of which 11 that are subject to one further repricing, the outcome is unlikely to differ greatly from the projections in Chart 9. On 18 May 2010 the total lifetime direct savings are projected to be $2.964 billion. Including second round, or financing benefits, the total savings are projected to be $4.126 billion.
Chart 9: Total Savings arising from interest rate swaps (inclusive of revaluations)
Conclusion
Since its inception 10 years ago, the AOFM has sought to minimise the cost of the Commonwealth’s debt portfolio. This was achieved through adjusting its structure to that of a benchmark whose characteristics were deemed to represent an optimal balance between reductions in cost and variability in those cost outcomes. Given issuance constraints, the tool used to bring about these outcomes was interest rate swaps.
The benchmark methodology relied upon the presence of a positive term premium. In recent years, yield curves began to flatten and eventually became inverted. This successively reduced the estimated term premium in annual benchmark reviews, and in 2008 ultimately led to the interest rate risk management framework being removed. Swaps became a legacy component of the portfolio and over a six month period between November 2008 and May 2009, nearly all were either unwound or matured. At end June 2009, those that remained are expected to mature within 12 months.
However, the repricing of risk that has occurred recently has seen a significant steepening in yield curves. Furthermore, the objective of issuing Treasury Bonds has gone from one of supporting the 3- and 10-year Treasury Bond futures contracts to that of funding the fiscal deficit. In the short term, with the removal of the interest rate risk management framework, the cost outcomes of the portfolio will be driven by that of issuance and maturities. Yet, as market conditions evolve, there may be scope for the AOFM to once again augment the issuance task with strategies aimed at further reducing debt servicing costs. To this end, the AOFM continues to review its portfolio management methodologies, and aims to allow the Commonwealth to raise debt in an efficient and cost effective manner.
Footnotes
[1] Short-dated exposure is a measure of the portfolio’s short term repricing risk.
[2] To allow cost outcomes to be judged in a more meaningful light, in 2006-07 the AOFM introduced another new model benchmark that tracked the ‘ideal’ model benchmark’s parameters as closely as possible, subject to rules that limit the volume of swaps that may be executed. This permitted a more realistic relative performance analysis of the actual portfolio where discretion is exercised in undertaking swaps versus a portfolio that undertook swaps regardless of outright swap rates, but was subject to volume constraints.

