The following is an extract taken from the AOFM’s 2012‑13 Annual Report. Readers should be aware that the strategies and conclusions presented may no longer reflect the current debt management practices used by the AOFM.
Determining the AOFM's debt strategy (PDF)
Introduction
The AOFM aims to provide a stable (that is, low risk) and low cost debt funding base for the government into the future. To achieve this objective the AOFM endeavours to conduct its operations in an open, transparent and predictable manner, with a focus on maintaining a liquid and efficient market in CGS. The AOFM also seeks to achieve the objective through its debt strategy by adjusting the maturity structure and composition of debt it issues each year.[1] Decision making on these factors requires considerable judgement given the uncertainty that surrounds the variables that will determine the future performance of the debt portfolio (that is, yield curves, inflation, fiscal position and various other macro variables) and the trade‑offs that exist between the cost of the portfolio and the level of risk being assumed. The intention of this article is to provide some insight into how the AOFM approaches strategic decision making given these uncertainties and trade‑offs.
Working with uncertainty
Each year, the AOFM evaluates alternative strategies for their compatibility with the debt management objectives. In choosing between the different options, the AOFM will make a judgement based on both quantitative and qualitative considerations. One of the quantitative tools the AOFM employs is a model of the macroeconomy and interest rate term structure. The model uses a mathematical representation of the historic behaviour and relationship between the macro/term structure variables to generate future scenarios that can be utilised to evaluate the performance of different debt strategies. By creating a sufficiently large number of scenarios, a picture of the statistical distribution of each explanatory variable in the model through time can be created. These distributions are effectively a representation, based on past experience, of the uncertainty the AOFM faces with respect to the real world variables that will influence future debt management outcomes.
In the next stage of the modelling process, the AOFM creates a suite of hypothetical debt issuance strategies representative of the options that the AOFM might consider. Each strategy is differentiated by the distribution of future issuance into distinct segments of the yield curve[2] and a target for the level of indexed debt in the portfolio. These strategies are scalable and can be matched to any future funding requirement scenario thereby enabling different trajectories for the stock of debt through time to be considered. It is relatively straightforward from here to calculate future debt servicing outcomes for each strategy using the macro/term structure scenarios created by the model. This then enables the cost and risk characteristics of competing strategies to be compared.
Measuring cost and risk
The measurement basis for cost is accrual debt service cost. This is typically expressed in percentage terms relative to the stock of the debt outstanding.[3]
In comparing the modelled cost performance of different debt strategies, the AOFM will evaluate both average costs over the projection horizon as well as cost outcomes in particular years. Because the AOFM does not issue debt with the intention of buying it back before maturity, unrealised market value gains and losses on the debt portfolio are not considered relevant to decision making with respect to the debt strategy.
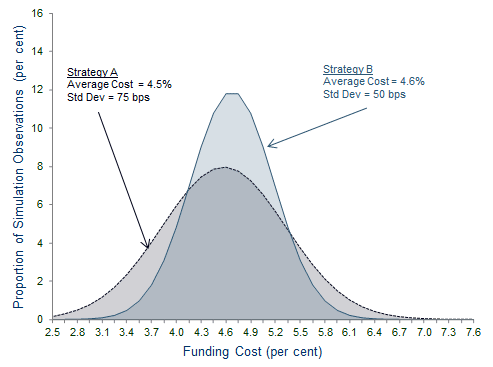
Risk is a function of the uncertainty the AOFM faces in relation to future debt servicing costs and is reflected in a comparison of the distribution of modelled cost outcomes for each debt strategy. Chart 1 below demonstrates this concept for two hypothetical strategies, Strategy A and Strategy B.
Strategy A focusses a higher proportion of issuance on short to medium term bonds. Average debt servicing costs are lower than Strategy B but this option is riskier as reflected in the more dispersed result set. Strategy B, which allocates a higher proportion of issuance into longer dated bonds, is more expensive on average but has a narrower expected range of outcomes. There is less uncertainty and therefore less ‘risk’ around cost outcomes in Strategy B. The AOFM uses a number of metrics to describe and summarise the risk of any given strategy. One such measure is Cost‑at‑Risk (CaR) which describes the maximum (or worst case) debt servicing cost outcome for a given time horizon and a given level of confidence or probability.[4]
Chart 1: Debt service cost distribution

Cost and risk trade-offs
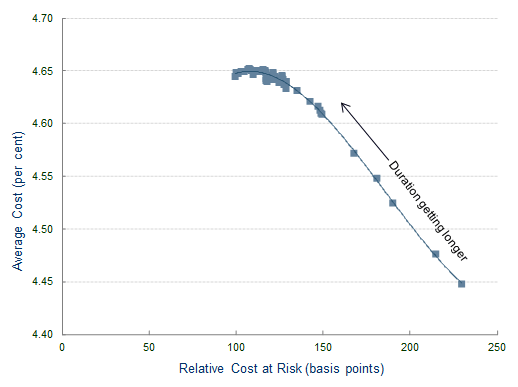
In Chart 2, there is a choice between pursuing a higher cost/lower risk strategy or a lower cost/higher risk strategy. This can be thought of as the debt manager needing to incur a cost (akin to an insurance premium) to reduce the inherent risk of the portfolio. This is because yield curves are typically upward sloping, reflecting among other things the greater opportunity costs and uncertainty faced by investors in longer bonds. This implies that cost savings can be achieved by pursuing a strategy that puts a greater weight of issuance into shorter‑dated bonds (and then refinances them as they mature) compared to issuing longer‑dated bonds. However, this will expose the portfolio to greater interest rate volatility and refinancing risks, which increases uncertainty about future debt service cost outcomes. Decision making on the debt strategy therefore requires cost and risk to be traded off against each other.
Chart 2 illustrates this trade‑off by displaying the modelled cost and risk properties of a range of hypothetical debt strategies.[5] Relative CaR is used as the measure of risk.
Chart 2: Debt service cost versus risk

Moving from right to left, the weight of bond issuance is progressively shifting from the ‘short end’ of the yield curve to the ‘long end’ and the duration of the portfolio is lengthening as a result. Risk progressively declines as this occurs but this comes at a price which is reflected in higher debt servicing costs. The rate of increase in cost declines as duration is extended. This is in part a consequence of bond yields trading near historic lows at the time the modelling data was created. Because bond yields are likely to increase through time from this low base,[6] there is a window where the benefit of locking in funding costs through the issuance of long maturity bonds (which extends duration) can, at least partially, offset the cost penalty associated with the upward sloping yield curve.
Selecting the Debt Strategy
Results that emerge from the AOFM’s modelling framework are one of a number of influences on strategic decision making. The AOFM will also take into account a range of domestic and global considerations that are more qualitative or subjective in nature. This may include an analysis of broader global economic and financial risk factors, as well as an examination of the AOFM’s debt refinancing profile and likely future call on the market given current fiscal projections, known financing requirements and Government policy (as it relates to the AOFM’s operations). It is rarely the case that all such considerations will push the AOFM’s debt strategy in the same direction. The final step involves reviewing ‘stress test’ results of the main strategic options under consideration. Stress tests are undertaken by identifying ‘states of the world’ that are unlikely but which would have a substantial impact on debt management outcomes.
Conclusion
Operational decisions on CGS issuance are guided by a broader strategy for the composition of the portfolio and the distribution of issuance across the yield curve. The AOFM considers a range of factors in determining the debt strategy including, but not limited to, the results of quantitative modelling of the cost‑risk trade‑offs the AOFM faces. Considerable judgement is required in weighing this evidence to determine the appropriate strategic direction of the portfolio.
Footnotes
[1] This refers to the distribution of CGS issuance across the yield curve and the mix between nominal and indexed debt.
[2] The AOFM segments the curve into buckets. Two buckets are formed by bond lines that fall (or are about to fall) into the three year and ten year futures baskets. Stocks that are longer, between, or shorter form separate buckets.
[3] This is necessary to allow a strategy's cost performance to be compared over time when the volume of debt is changing.
[4] CaR can be measured in absolute or relative terms. An example of absolute CaR is the worst case cost outcome with a probability of 95 per cent in a year. Relative CaR is the difference between absolute CaR and the average cost outcome.
[5] The chart is constructed from modelling data created in 2012. Each plot point is representative of a single debt strategy. Strategies vary only in the allocation of Treasury Bond issuance to different segments of the yield curve.
[6] This effect is often referred to as ‘mean reversion’.

