Ultra-long end of the Treasury Bond market
Issue 6 | AOFM Investor Insights | January 2021 | PDF
This edition of Investor Insights considers the ultra-long end of the Treasury Bond market. The focus of this paper is investor demand for ultra-long bonds, specifically 30-year bonds, and the benefits that derive from maintaining a 30-year sovereign yield curve. Comparable maturity extensions have also been achieved in the Treasury Indexed Bond market. However, the issues and considerations are different given the smaller and more domestically concentrated nature of the investor base.
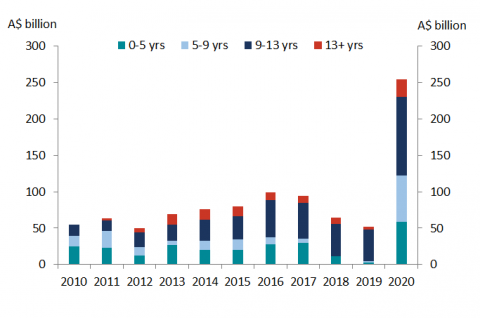
The AOFM issued around $255 billion of Treasury Bonds in calendar 2020, by far the largest year for issuance and nearly five times the volume issued in 2019. Issuance in bonds longer than 13 years’ maturity was around $25 billion (10 per cent of the total) – of this $15 billion was for the initial issue of the 2051 bond. Chart 1 shows annual issuance by tenor ranges since 2010. The relatively small contribution made by ultra-long bonds to the overall issuance task tends to understate this market segment's importance. For investors, it has extended opportunity to participate in the AGS market (making this market more relevant in a global context) while for the AOFM it has supported portfolio management objectives through further diversification of the investor base and increasing 'average-term-to-maturity' (ATM).
Chart 1: Annual Treasury Bond issuance by tenor range
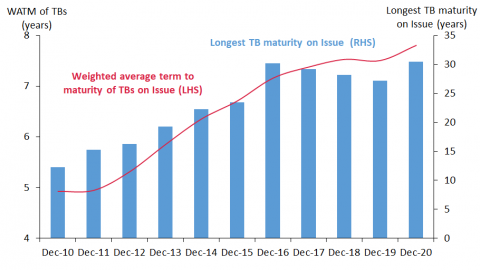
Chart 2 shows the gradual extension of the yield curve from around 12 years in 2010 to 30 years in 2016. Over that period the weighted ATM of Treasury Bonds on issue increased from about five years to just under eight years by the end of 2020. The key motivations for the AOFM in extending the yield curve included:
- Reducing refinancing risk[1] in the face of large issuance volumes following the GFC.
- Minimising the variability of future debt service cost outcomes.
- Increasing the range of issuance options available.
- Increasing the diversity of the AGS investor base.
- A broader market development objective of establishing a longer risk-free price benchmark, which would allow other issuers including state governments and corporate issuers to more readily cost longer-dated borrowing.
Chart 2: Treasury Bond curve extension
Key Insight: The 30-year benchmark facilitates two main objectives – lengthening the portfolio's duration and diversifying the investor base.
An internationally recognised benchmark
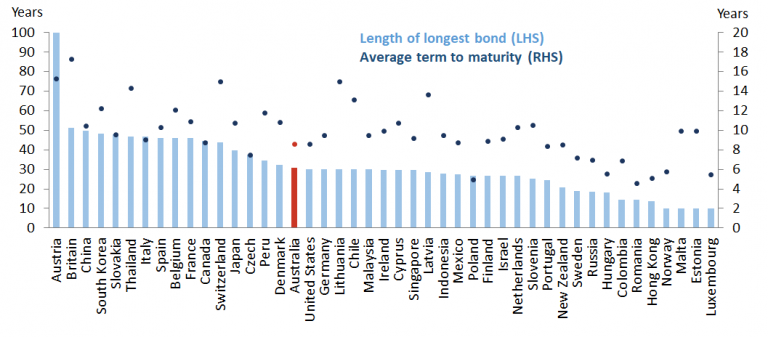
The 30-year point is a significant benchmark for many sovereign bond markets and a focal point for many investors. Establishing a 30-year Treasury Bond curve brought it into line with other markets (Chart 3 below) and improved its attractiveness to both offshore and domestic investors.
Chart 3: Length of longest bond and weighted average term to maturity (WATM)* for developed sovereign bond markets
Ultra-long bond demand drivers
The Australian yield curve has tended to be steeper than other comparably rated sovereign curves, which enhances the attractiveness of ultra-long dated AGBs.
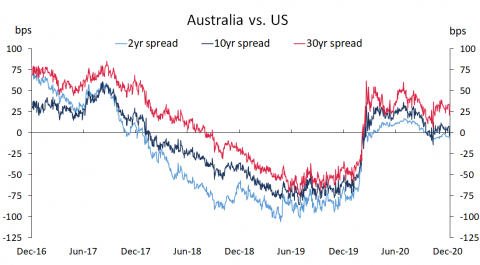
Many investors are focused on the spread between US Treasuries (USTs) and Australian Government Bonds (AGBs) - in general, a wider spread to USTs attracts greater offshore interest. Chart 4 shows that the spread to USTs has been positive since April 2020, with the 30-year spread consistently wider than shorter-dated spreads.
Chart 4: AGB and UST yield spreads
Key insight: Yields relative to other markets is a key driver of investor demand in ultra-long bonds.
It is often more straightforward for some offshore investors to focus on investment returns in their currency – USD, Euro and Yen being the most dominant currencies. Currency hedging not only facilitates investment without taking FX risk; it may also provide investors with an avenue for additional return. Chart 5 shows that since April 2020 a 10 or 30 year Treasury Bond with cash flows hedged back to the domestic currency of US, Germany or Japan provides yields significantly higher than comparable bonds in the investors’ home sovereign bond markets. For each country, the hedged yield spread is wider for 30-year bonds than for 10-year bonds.
Chart 5. AGB yield spread on a 3-month FX forward hedged basis (20-day m.a.)*
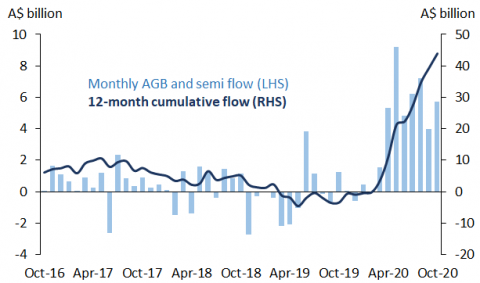
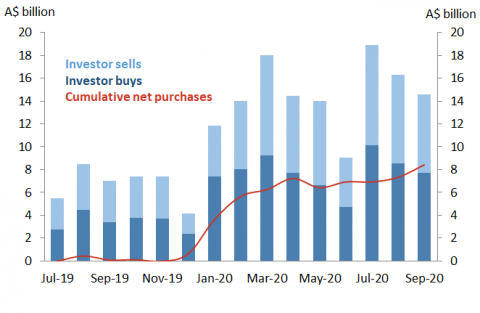
Chart 6 shows that for the period April 2020 to October 2020, Japanese investors bought around $42 billion of AGBs and semi-government bonds. This coincided with the 10-and 30-year AU/US spread turning positive (chart 4), and the FX hedged spread to 10-and 30-year JGBs also moving strongly positive (Chart 5, red line).
Chart 6: Net purchases of AGBs and semi-government bonds by Japanese investors
Key insight: Yields net of hedging costs are also an important consideration.
Ultra-long bond demand from offshore investors
As of 30 September 2020, offshore investors held around 58 per cent of AGS outstanding by market value[2]. The Australian Bureau of Statistics (ABS) does not publish offshore holdings by tenor or by region; however secondary market trading data, AOFM ultra-long dated syndications, and direct engagement with investors suggest that offshore holdings in the ultra-long end may be considerably higher[3].
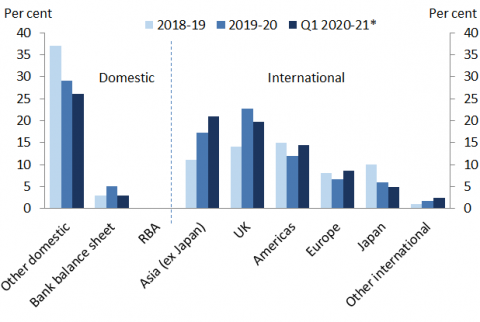
Chart 7 shows in 2019-20 around two-thirds of secondary market trading activity in bonds 12 years and longer between market makers and investors was conducted with offshore counterparties with Asia (ex-Japan), the UK and the Americas being the most represented regions. The reverse is the case for bonds shorter than 12 years with less than 40 per cent of turnover in 2019-20 conducted with offshore investors.
Chart 7: 12+ year Treasury Bond turnover by region (ex-interbank)
Fund managers (who have a natural demand to match long-dated liabilities) comprise the largest investor category both by the amount allocated and the number of investors for ultra-long syndications, with around two-thirds of ultra-long bonds on average being taken at syndications and with this investor type being more likely to hold this stock for longer.
Key insight: Offshore investors hold proportionately more ultra-long bonds than the overall market ownership represents.
Secondary market liquidity in the ultra-long end
Liquidity in ultra-long bonds is lower than shorter-dated bonds both in Australia and other markets[4]. Investors in ultra-long bonds tend to ‘buy and hold’ which in turn impacts liquidity. They also represent a higher source of duration risk for trading accounts, which could impact the extent to which intermediaries engage in this market sector. AOFM turnover data shows that less than 10 per cent of total Treasury Bond turnover is in bonds longer than 12 years.
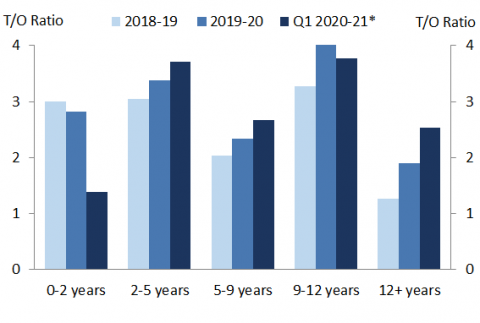
Chart 8 shows that when the volume on issue is considered in each tenor range, the turnover ratio for 12+ years in 2019-20 is not that much lower than some other tenor ranges. On an annualised basis the 12+ year turnover ratio for the first quarter of 2020-21 was comparable to 5‑9 years and much higher than 0-2 years.
Chart 8: Treasury Bond turnover ratio by maturity
Chart 9 shows that monthly turnover for 12+ year bonds began picking up in January 2020. The impact on turnover of the $15 billion June 2051 syndication in July 2020 can be seen in July's spike.
Chart 9: 12+ year Treasury Bond turnover
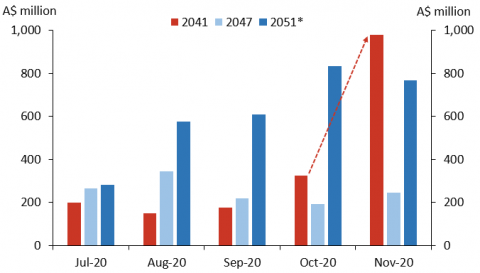
The AOFM turnover survey does not capture trading in individual bond lines, but the MIFID II[5] reporting requirements does. Turnover is usually highest in the longest dated bond (30-year bond), and syndicated issuance often coincides with an increase in turnover – this is particularly evident for the $6 billion syndicated tap of the 2041 bond in November (see chart 10 below).
Chart 10: MIFID II trading data – longest three bonds, July-November 2020.
Key insight: Syndicated bond issues increase secondary market turnover in the ultra-long end.
Summary
The AOFM has developed the ultra-long sector of the market through extending the yield curve to 30 years (including the introduction of new maturities to support the 20-year futures contract). The recent establishment of a new 2051 benchmark maturity has consolidated this market/portfolio development objective. The process has extended the ATM of the debt portfolio and further diversified the AGS investor base.
While the ultra-long end of the yield curve here has tended to be steeper than in comparable sovereign bond markets, its features do not stand in contrast to those markets. These features include: high proportions of European, Japanese and North American investor ownership; strong fund manager participation; and generally lower liquidity.
AOFM expectations are for the characteristics of this market segment to remain relatively stable. Therefore, regular issuance and the periodic introduction of new maturities will underpin the necessary support to attract meaningful ongoing investor engagement.

